The ICT Development Index (IDI), which has been published annually since 2009, is a composite index that combines 11 indicators into one benchmark measure. It is used to monitor and compare developments in information and communication technology (ICT) between countries and over time.
The main objectives of the IDI are to measure:
- the
level and evolution over time of ICT developments within countries and the experience of those countries relative to others;
- progress in ICT development
in both developed and developing countries;
- the
digital divide, i.e. differences between countries in terms of their levels of ICT development; and
- the
development potential of ICTs and the extent to which countries can make use of them to enhance growth and development in the context of available capabilities and skills.
The Index is designed to be global and reflect changes taking place in countries at different levels of ICT development. It therefore relies on a limited set of data which can be established with reasonable confidence in countries at all levels of development.
Recognizing that ICTs can be development enablers is central to the IDI’s conceptual framework. The ICT development process, and a country’s evolution towards becoming an information society, can be depicted using the three-stage model illustrated in Figure 1:
-
Stage 1: ICT readiness – reflecting the level of networked infrastructure and access to ICTs;
-
Stage 2: ICT intensity – reflecting the level of use of ICTs in the society; and
-
Stage 3: ICT impact – reflecting the results/outcomes of more efficient and effective ICT use.
Figure 1:
Three stages in the evolution towards an information society
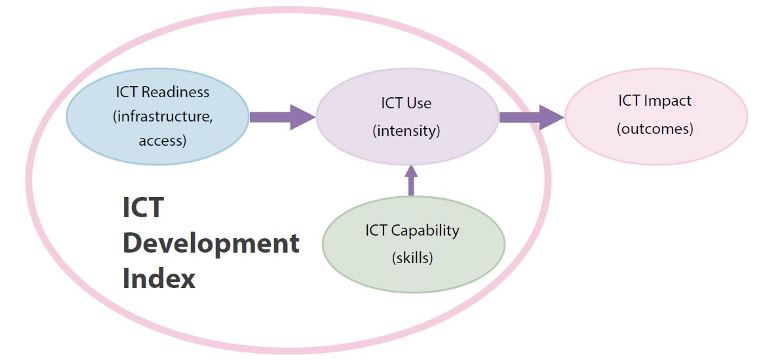
Source: ITU.
Based on this conceptual framework, the IDI is divided into the following three sub-indices, and a total of 11 indicators (Figure 2).
-
Access sub-index: This sub-index captures ICT readiness, and includes five infrastructure and access indicators (fixed-telephone subscriptions, mobile-cellular telephone subscriptions, international Internet bandwidth per Internet user, households with a computer, and households with Internet access).
-
Use sub-index: This sub-index captures ICT intensity, and includes three intensity and usage indicators (individuals using the Internet, fixed broadband subscriptions, and mobile-broadband subscriptions).
-
Skills sub-index: This sub-index seeks to capture capabilities or skills which are important for ICTs. It includes three proxy indicators (adult literacy, gross secondary enrolment, and gross tertiary enrolment). As these are proxy indicators, rather than indicators directly measuring ICT-related skills, the skills sub-index is given less weight in the computation of the IDI than the other two sub-indices.
Figure 2: ICT Development Index: indicators, reference values and weights
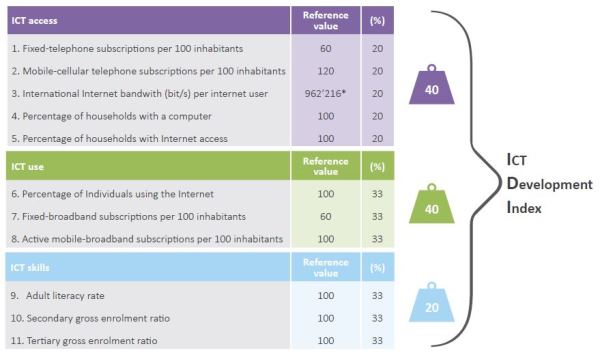
Note: *This corresponds to a log value of 5.98, which was used in the normalization step.
Source: ITU.
The following provides more details on various steps involved, such as the indicators included in the index and their definition, the imputation of missing data, the normalization procedure, the weights applied to the indicators and sub-indices, and the results of the sensitivity analysis.
1. Indicators included in the IDI
The selection of indicators was based on certain criteria, including relevance for the index objectives, data availability and the results of various statistical analyses such as the principal component analysis (PCA).1 The following 11 indicators are included in the IDI (grouped by the three sub-indices: access, use and skills).
a) ICT infrastructure and access indicators
Indicators included in this group provide an indication of the available ICT infrastructure and individuals’ access to basic ICTs. Data for all these indicators are collected by ITU.2
1. Fixed-telephone subscriptions per 100 inhabitants
Fixed-telephone subscriptions refers to the sum of active analogue fixed-telephone lines, voice-over-IP (VoIP) subscriptions, fixed wireless local loop (WLL) subscriptions, ISDN voice-channel equivalents and fixed public payphones. It includes all accesses over fixed infrastructure supporting voice telephony using copper wire, voice services using Internet Protocol (IP) delivered over fixed (wired)-broadband infrastructure (e.g. DSL, fibre optic), and voice services provided over coaxial-cable television networks (cable modem). It also includes fixed wireless local loop (WLL) connections, defined as services provided by licensed fixed-line telephone operators that provide last-mile access to the subscriber using radio technology, where the call is then routed over a fixed-line telephone network (not a mobile-cellular network). In the case of VoIP, it refers to subscriptions that offer the ability to place and receive calls at any time and do not require a computer. VoIP is also known as voice-over-broadband (VoB), and includes subscriptions through fixed-wireless, DSL, cable, fibre-optic and other fixed-broadband platforms that provide fixed telephony using IP.
2. Mobile-cellular telephone subscriptions per 100 inhabitants
Mobile-cellular telephone subscriptions refers to the number of subscriptions to a public mobile telephone service providing access to the public switched telephone network (PSTN) using cellular technology. It includes both the number of postpaid subscriptions and the number of active prepaid accounts (i.e. that have been active during the past three months). It includes all mobile-cellular subscriptions that offer voice communications. It excludes subscriptions via data cards or USB modems, subscriptions to public mobile data services, private trunked mobile radio, telepoint, radio paging and telemetry services.
3. International Internet bandwidth (bit/s) per Internet user
International Internet bandwidth refers to the total used capacity of international Internet bandwidth, in megabits per second (Mbit/s). Used international Internet bandwidth refers to the average traffic load of international fibre-optic cables and radio links for carrying Internet traffic. The average is calculated over the 12-month period of the reference year, and takes into consideration the traffic of all international Internet links. If the traffic is asymmetric, i.e. if there is more incoming (downlink) than outgoing (uplink) traffic, the average incoming (downlink) traffic load is used. The combined average traffic load of different international Internet links can be reported as the sum of the average traffic loads of the individual links. International Internet bandwidth (bit/s) per Internet user is calculated by converting to bits per second and dividing by the total number of Internet users.
4. Percentage of households with a computer
Computer refers to a desktop computer, laptop (portable) computer, tablet or similar handheld computer. It does not include equipment with some embedded computing abilities, such as smart TV sets, or devices with telephony as a main function, such as mobile phones or smartphones.
Household with a computer means that the computer is available for use by all members of the household at any time. The computer may or may not be owned by the household, but should be considered a household asset.3
Data are obtained by countries through national household surveys and are either provided directly to ITU by national statistical offices (NSO) or obtained by ITU through its own research, for example from NSO websites. There are certain data limits to this indicator, insofar as estimates have to be calculated for many developing countries which do not yet collect ICT household statistics. Over time, as more data become available, the quality of the indicator will improve.
5. Percentage of households with Internet access
The
Internet is a worldwide public computer network. It provides access to a number of communication services, including the World Wide Web, and carries e-mail, news, entertainment and data files, irrespective of the device used (not assumed to be only a computer; it may also be a mobile telephone, tablet, PDA, games machine, digital TV, and so on). Access can be via a fixed or mobile network.
Household with Internet access means that the Internet is available for use by all members of the household at any time.4
Data are obtained by countries through national household surveys and are either provided directly to ITU by national statistical offices (NSOs) or obtained by ITU through its own research, for example from NSO websites. There are certain data limits to this indicator, insofar as estimates have to be calculated for many developing countries which do not yet collect ICT household statistics. Over time, as more data become available, the quality of the indicator will improve.
b) ICT use indicators
The indicators included in this group capture ICT intensity and usage. Data for all these indicators are collected by ITU.5
1. Percentage of individuals using the Internet
Individuals using the Internet refers to people who used the Internet from any location and for any purpose, irrespective of the device and network used in the last three months. It can be via a computer (i.e. desktop computer, laptop computer, tablet or similar handheld computer), mobile phone, games machine, digital TV, etc. Access can be via a fixed or mobile network.
Data are obtained by countries through national household surveys and are either provided directly to ITU by national statistical offices (NSOs), or obtained by ITU through its own research, for example from NSO websites. There are certain data limits to this indicator, insofar as estimates have to be calculated for many developing countries which do not yet collect ICT household statistics. Over time, as more data become available, the quality of the indicator will improve.
2. Fixed-broadband subscriptions per 100 inhabitants
Fixed-broadband subscriptions refers to fixed subscriptions for high-speed access to the public Internet (a TCP/IP connection), at downstream speeds equal to or greater than 256 kbit/s. This includes cable modem, DSL, fibre-to-the-home/building, other fixed-broadband subscriptions, satellite broadband and terrestrial fixed wireless broadband. This total is measured irrespective of the method of payment. It excludes subscriptions that have access to data communications (including the Internet) via mobile-cellular networks. It includes fixed WiMAX and any other fixed wireless technologies, and both residential subscriptions and subscriptions for organizations.
3. Active mobile-broadband subscriptions per 100 inhabitants
Active mobile-broadband subscriptions refers to the sum of standard mobile-broadband subscriptions and dedicated mobile-broadband subscriptions. The subscriptions can be used through handset based or computer-based (USB/dongles) devices. It covers actual subscribers, not potential subscribers, even though the latter may have broadband-enabled handsets.
-
Standard mobile-broadband subscriptions refers to active mobile-cellular subscriptions with advertised data speeds of 256 kbit/s or greater that allow access to the greater Internet via HTTP and which have been used to set up an Internet data connection using Internet Protocol (IP) in the past three months. Standard SMS and MMS messaging do not count as active Internet data connection, even if messages are delivered via IP.
-
Dedicated mobile-broadband data subscriptions refers to subscriptions to dedicated data services (over a mobile network) that allow access to the greater Internet and are purchased separately from voice services, either as a stand-alone service (e.g. using a data card such as a USB modem/dongle) or as an add-on data package to voice services which requires an additional subscription. All dedicated mobile-broadband subscriptions with recurring subscription fees are included regardless of actual use. Prepaid mobile-broadband plans require use of the monthly data allowance where there is no monthly subscription. This indicator could also include mobile WiMAX subscriptions.
c) ICT skills indicators
Data on adult literacy rates and gross secondary and tertiary enrolment ratios are collected by the UNESCO Institute for Statistics (UIS).
1. Adult literacy rate
According to UIS, the
Adult literacy rate is defined as “the percentage of population aged 15 years and over who can both read and write with understanding a short simple statement on his/her everyday life. Generally, ‘literacy’ also encompasses ‘numeracy’, the ability to make simple arithmetic calculations.” The main purpose of this indicator is “to show the accumulated achievement of primary education and literacy programmes in imparting basic literacy skills to the population, thereby enabling them to apply such skills in daily life and to continue learning and communicating using the written word. Literacy represents a potential for further intellectual growth and contribution to economic-socio-cultural development of society.”6
2. Gross enrolment ratio (secondary and tertiary level)
According to UIS, the gross enrolment ratio is “the total enrolment in a specific level of education, regardless of age, expressed as a percentage of the eligible official school-age population corresponding to the same level of education in a given school-year.”
2. Imputation of missing data
A critical step in the construction of the index is to create a complete data set, without missing values. A number of imputation techniques can be applied to estimate missing data.7 Each of the imputation techniques, like any other method employed in the process, has its own strengths and weaknesses. The most important consideration is to ensure that the imputed data will reflect a country’s actual level of ICT access, usage and skills.
Given that ICT access and usage are both correlated with national income, hot-deck imputation was chosen as the method for imputing the missing data where previous year data are not available to calculate growth rates. Hot-deck imputation uses data from countries with “similar” characteristics, such as GNI per capita and geographic location. For example, missing data for country A were estimated for a certain indicator by first identifying countries in the same region with similar levels of GNI per capita, and an indicator that has a known relationship to the indicator to be estimated. For instance, Internet use data for country A was estimated by using Internet use data for country B from the same region and with a similar GNI per capita and similar level of fixed Internet and wireless broadband subscriptions. The same logic was applied to estimate missing data for all indicators included in the index.
3. Normalization of data
Normalization of data is necessary before any aggregation can be made in order to ensure that the data set uses the same unit of measurement. As regards the indicators selected for the construction of the IDI, it is important to convert the values into the same unit of measurement, since some values are expressed as a percentage of the population/total households, whereby the maximum value is 100, while other indicators can have values exceeding 100, such as mobile-cellular and active mobile-broadband penetration or international Internet bandwidth (expressed as bit/s per user).
Certain particularities need to be taken into consideration in selecting the normalization method for the IDI. For example, in order to identify the digital divide, it is important to measure the relative performance of countries (i.e. the divide among countries). Secondly, the normalization procedure should produce index results that allow countries to track progress in their evolution towards an information society over time.
A further important criterion for selecting the normalization method was replicability by countries, as some countries have shown a strong interest in applying the index methodology at the national or regional level. Certain methods therefore cannot be applied, for example those that rely on the values of other countries, which might not be available to users.
For the IDI, the distance to a reference measure was used as the normalization method. The reference measure is the ideal value that could be reached for each variable (similar to a “goalpost”). For all the indicators chosen, this will be 100 except for the following four indicators:
- International Internet bandwidth per Internet user. To diminish the effect of the huge dispersion of values, the data were first converted to a logarithmic (log) scale. Outliers were then identified using a cut-off value calculated by adding two standard deviations to the mean of the rescaled values.
- Mobile-cellular subscriptions per 100 inhabitants. The reference value for mobile-cellular subscriptions was reviewed in the last edition of the index and was lowered to 120, a value derived by examining the distribution of countries based on their value for mobile-cellular subscriptions per 100 inhabitants in 2013. For countries where postpaid is the predominant mode of subscription, 120 is the maximum value attained, while in countries where prepaid is dominant (57 per cent of all countries included in the IDI have more than 80 per cent prepaid subscriptions) 120 is also the maximum value attained by a majority of countries. It was therefore concluded that 120 is the ideal value that a country could attain, irrespective of the predominant type of mobile subscription.
- Fixed-telephone subscriptions per 100 inhabitants. The reference value was calculated by adding two standard deviations to the mean, resulting in a rounded value of 60 per 100 inhabitants.
Fixed-broadband subscriptions per 100 inhabitants. In line with fixed-telephone subscriptions, the ideal value was defined as 60 per 100 inhabitants.
After normalizing the data, the individual series were all rescaled to identical ranges, from 1 to 10. This was necessary in order to compare the values of the indicators and the sub-indices.
4. Weighting and aggregation
The indicators and sub-indices included in the IDI were weighted on the basis of the PCA results obtained when the index was first computed.8
|
|
Weights
(indicators) |
Weights
(sub indices) |
|
ICT access | |
0.40 |
|
Fixed-telephone subscriptions per 100 inhabitants |
0.20 | |
|
Mobile-cellular telephone subscriptions per 100 inhabitants |
0.20 | |
|
International Internet bandwidth per Internet user |
0.20 | |
|
Percentage of households with a computer |
0.20 | |
|
Percentage of households with Internet access |
0.20 | |
|
ICT use | |
0.40 |
|
Percentage of individuals using the Internet |
0.33 | |
|
Fixed-broadband Internet subscriptions per 100 inhabitants |
0.33 | |
|
Active mobile-broadband subscriptions per 100 inhabitants |
0.33 | |
|
ICT skills | |
0.20 |
|
Adult literacy rate |
0.33 | |
|
Secondary gross enrolment ratio |
0.33 | |
Source: ITU.
5. Calculating the IDI
Sub-indices were computed by summing the weighted values of the indicators included in the respective subgroup.
-
ICT access is measured by fixed-telephone subscriptions per 100 inhabitants, mobile-cellular subscriptions per 100 inhabitants, international Internet bandwidth per Internet user, percentage of households with a computer and percentage of households with Internet access.
-
ICT use is measured by percentage of individuals using the Internet, fixed-broadband Internet subscriptions per 100 inhabitants and active mobile-broadband subscriptions per 100 inhabitants.
-
ICT skills are approximated by adult literacy rate, secondary gross enrolment ratio and tertiary gross enrolment ratio.
The values of the sub-indices were calculated first by normalizing the indicators included in each sub index in order to obtain the same unit of measurement. The reference values applied in the normalization were discussed above. The sub-index value was calculated by taking the simple average (using equal weighting) of the normalized indicator values.
For computation of the final index, the ICT access and ICT use sub-indices were each given a 40 per cent weighting, and the skills sub-index (because it is based on proxy indicators) a 20 per cent weighting. The final index value was then computed by summing the weighted sub-indices.
6. Sensitivity analysis
Sensitivity analysis was carried out to investigate the robustness of the index results, in terms of the relative position in the overall ranking, using different combinations of methods and techniques to compute the index.
Potential sources of variation or uncertainty can be attributed to different processes employed in the computation of the index, including the selection of individual indicators, the imputation of missing values and the normalization, weighting and aggregation of the data.
Each of the processes or combination of processes affects the IDI value. A number of tests were carried out to examine the robustness of the IDI results (rather than the actual values). The tests computed the possible index values and country rankings for different combinations of the processes mentioned above. Results show that, while the computed index values change, the message remains the same. The IDI was found to be extremely robust with regard to different methodologies, with the exception of certain countries including in particular those in the “high” group.
The relative position of countries included in the “high” group (see Chapter 2) can change depending on the methodology used. Caution should therefore be exercised in drawing conclusions based on these countries’ rankings. However, the relative position of countries included in the “low” group is in no way affected by the methods or techniques used, and the countries in this group ranked low in all index computations using different methodologies. This confirms the results conveyed by the IDI.
-------------------
Notes:
1 PCA was used to examine the underlying nature of the data. A more detailed description of the analysis is available in Annex 1 to the
Measuring the Information Society Report 2009.
2 More information about the indicators is available in the ITU
Handbook for the collection of administrative data on telecommunications/ICT 2011 and the ITU
Manual for Measuring ICT Access and Use by Households and Individuals 2014.
3 This definition reflects the revisions agreed by the ITU Expert Group on ICT Household Indicators (EGH) at its meeting in Sao Paulo, Brazil, 4-6 June 2013. See http://www.itu.int/en/ITU-D/Statistics/Documents/events/brazil2013/Final_report_EGH.pdf
4 See footnote 3.
5 See footnote 2.
6 UIS
Education Indicators: Technical Guidelines. See
http://www.uis.unesco.org/ev.php?ID=5202_201&ID2=DO_TOPIC
7 See OECD and European Commission (2008).
8
For more details, see Annex 1 to the
Measuring the Information Society Report 2009.