Connecting the world and beyond

ITU Statistics Update - December 2025

WHAT’S NEW IN ICT STATISTICS


TOPIC SPOTLIGHT - MEASURING HOUSEHOLD EXPENDITURE ON ICT SERVICES


Household expenditure data provide insights into the amounts families are prepared to pay for ICT services. In the richest countries, where GNI per capita (GNIpc, adjusted for differences in purchasing power) exceeds USD 55 000, ICT services typically account for 2-3 per cent of household expenditure while in economies with a GNIpc between USD 22 000 and USD 55 000, the share of expenditure ranges from 3 to 6 per cent; and in some economies with a GNIpc below USD 20 000, households may spend up to nearly 9 per cent. 

Indicator HH16 from the core ICT indicators list captures annual household expenditure on ICT goods and services and is generally derived from household budget surveys (HBS), income and expenditure surveys, and only occasionally through specific surveys on ICT access and use with dedicated expenditure modules. Data collection involves asking households to report on categories defined by UNSD - COICOP classification such as:
Despite the insights provided by ICT expenditure data, availability remains limited, except in the European Union, whose members submit HBS data to Eurostat, disaggregated by types of goods and services. Indeed, HBS are costly operations and are usually programmed when updates of the basket for the Consumer Price Index or National Accounts are scheduled. Additionally, specific data collection challenges appear, such as respondent fatigue, and recall bias (households may have difficulties in accurately remembering their ICT spending, especially for small, irregular, or bundled purchases). 

ITU provides guidance on the consumption items to be considered as ICT goods and services in the Manual for Measuring ICT Access and Use by Households and Individuals, 2020 Edition.

UPCOMING Activities

Recent publications


Global Connectivity Report 2025: The report charts global connectivity’s rise from a rarity in 1994 to a daily necessity today. It focuses on universal and meaningful connectivity (UMC) across quality, availability, affordability, devices, skills and security. While showcasing digital progress, it also highlights persistent divides and growing risks and provides evidence-based guidance to strengthen affordability, skills, regulation and infrastructure to accelerate progress toward UMC.


Facts and Figures 2025​: This edition presents updated global, regional and income-group estimates for key connectivity indicators. The 2025 edition shows that nearly three-quarters of the world is now online, but progress is slowing and 2.2 billion people – mostly in low- and middle-income countries – still remain offline.


DID YOU KNOW?


There are affordability gaps not only between high- and low-income economies, but also within countries.

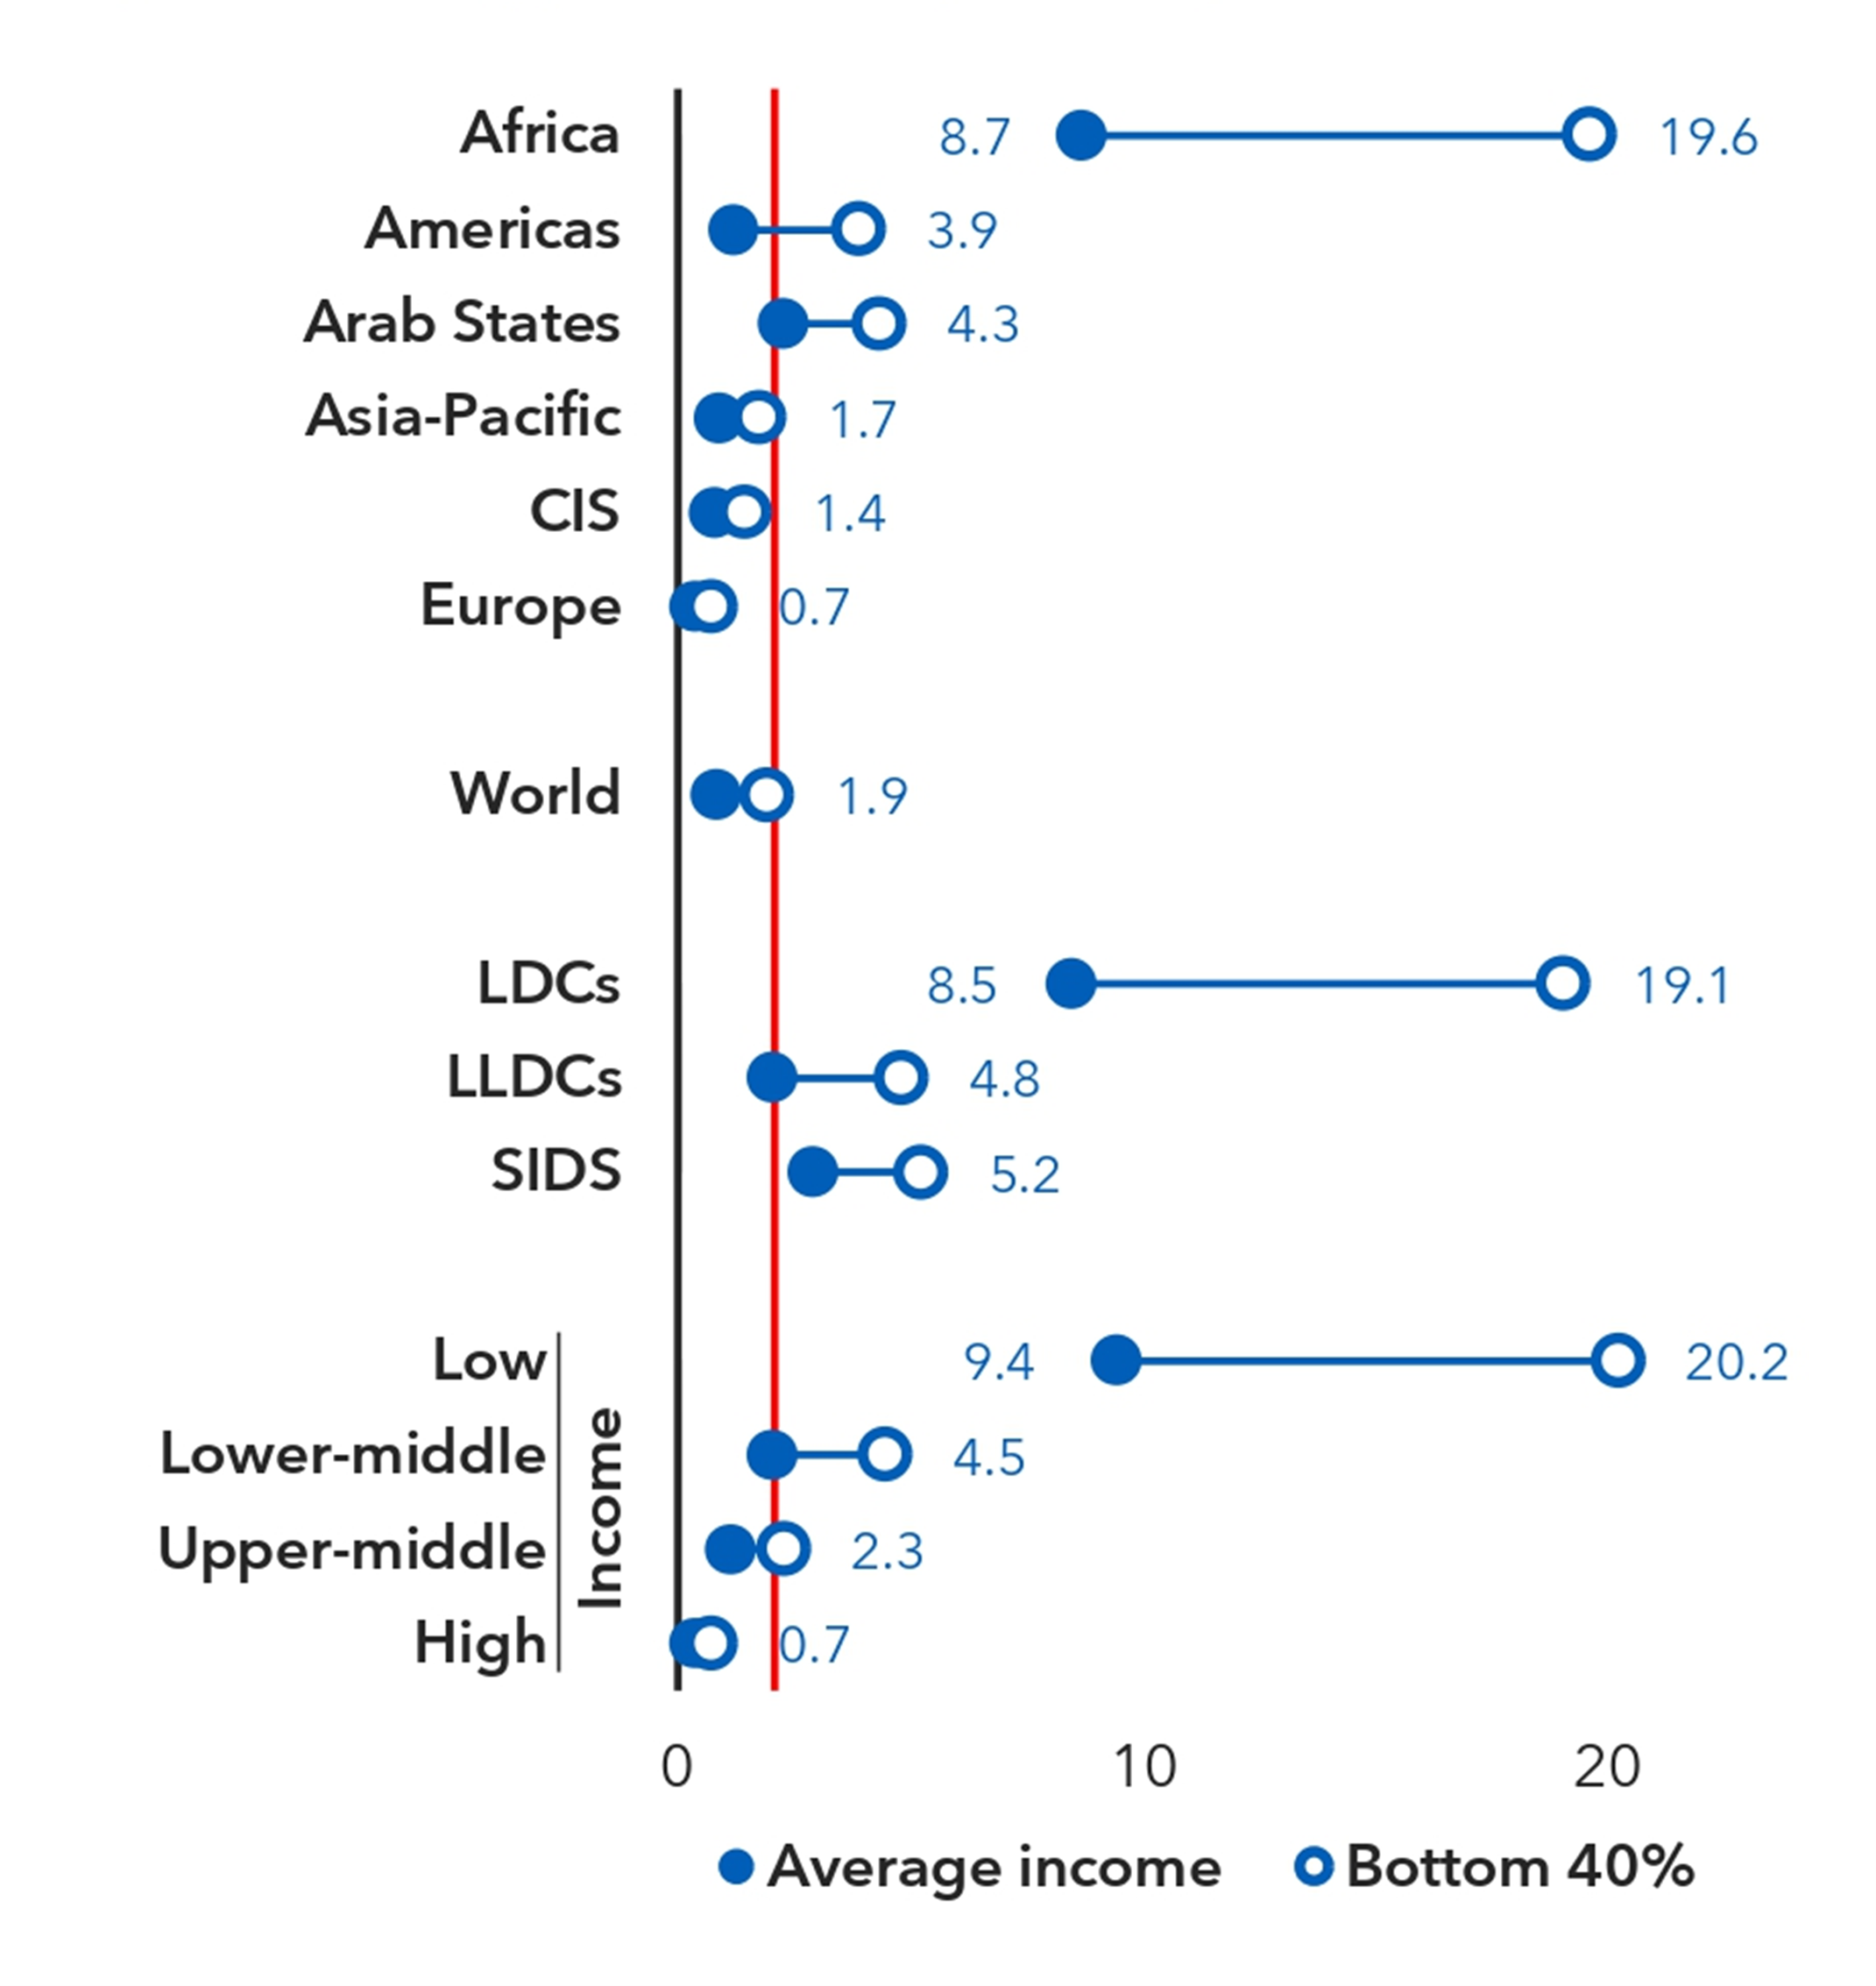
ITU price statistics combined with inequality data from the World Bank, published in the Global Connectivity Report 2025 (figure 4.6), reveal wide gaps between how much a mobile broadband basket amounts to those earning the average income, and those among the poorest 40 per cent of the population. 


Note: Based on 107 countries with available recent inequality survey data (not older than 2019) and price data (2025).

Source: World Bank PIP, ITU.


Join the conversation


Have questions or insights? We’d love to hear from you! Share your thoughts with the ICT Data and Analytics Division, BDT on social media using the hashtag #ICTStats, or get in touch via e-mail for suggestions and questions.

​Share the subscribe link | Unsubscribe​