Committed to connecting the world

WTISD

Infrastructure Mapping and Analysis for School Connectivity

​​​​​​​​​​The Future Networks and Spectrum Management Division (FNS)​ is providing Infrastructure mapping aiming at supporting connectivity projects, such as Giga, an ITU-UNICEF initiative aiming to connect all schools to the internet. Given the limitations of many countries' ICT infrastructure and budget, comprehensive plans for phased connectivity projects are crucial to maximizing resource use. This involves exten​sive data collection and processing to understand school's connectivity options for every school.

Infrastructure mapping and analysis, evaluates a connectivity target from collaborating countries, for instance schools. Key parameters include: onnectivity status, potential connection alternatives, and supporting infrastructure, like power lines. By overlaying physical infrastructure with cost details, estimations on the expenditure associated with different connection technologies can be executed. Then, aggregated data is represented by interactive maps (see examples below) that improve the understanding on how connectivity is available.  Relevant components of a network can be highlighted, like mobile coverage availability, distance from fiber nodes, cell tower visibility, etc. These maps can be used for decision-making with regards to closing connectivity gap​s.

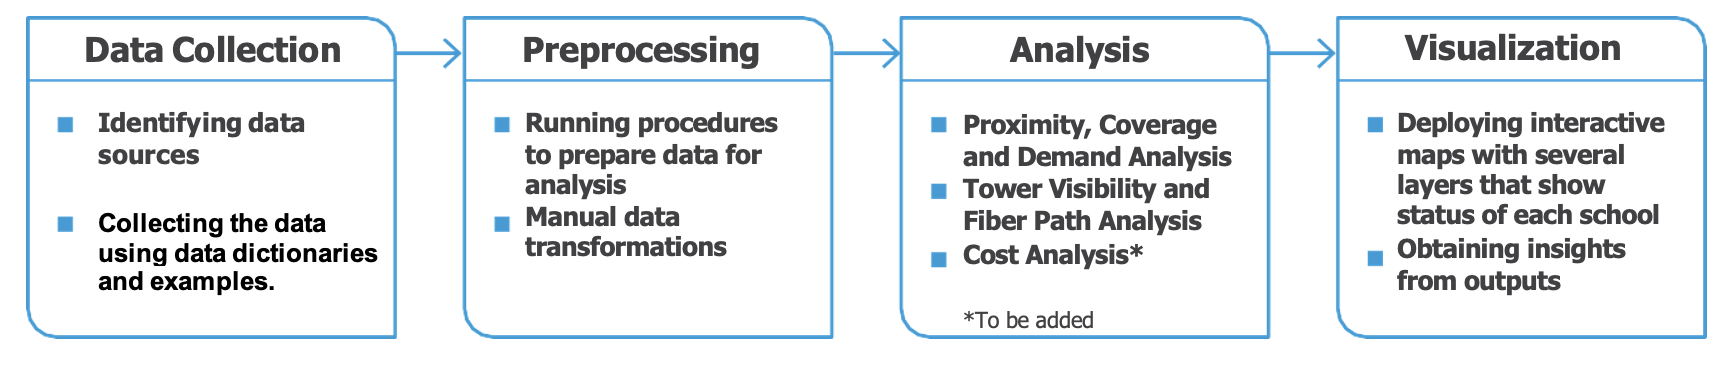
INFRASTRUCTURE ANALYSIS WORKFLOW

Screenshot 2023-05-30 at 21.15.23.png​​

1. Data Collection

​​Data collection starts with an initial research on possible data sources  to identify the most relevant and reliable information. Part of the data is gathered using data dictionaries, which contain lists of parameters along with their descriptions and examples. These dictionaries are shared with potential data providers (usually the Ministries of ICTs, regulatory authorities, MNOs, ISPs) to assist them in organizing the data in an standard manner. Additionally, data is also collected from public resources through crowdsourcing platforms, open publications, or resources that offer freely available data.​

2. Pre-processing

Data from the field often need pre-processing to address inconsistencies or gaps. When necessary, providers are contacted for clarifications. The data quality is evaluated, and incorrect parameters are fixed or discarded if possible. Missing parameter values are frequently replaced with educated assumptions. Each input is assigned a unique ID, and the correctness of data types and geolocation accuracy are checked. Manual interventions like geo-coding, geo-referencing, and coordinate reference system transformations may be necessary depending on the data's quality and nature.

3. Analysis

In this stage, school and infrastructure data are examined using distance and coverage metrics. The distances from schools to the nearest fiber nodes and cell towers are calculated, and the availability of mobile coverage at school locations is assessed. When suffici​ent data is available, the visibility from schools to cell towers is analyzed, and fiber routes are evaluated. This process assists in identifying optimal towers for connectivity and projecting the most cost-effective fiber node connections along existing roadways. Additionally, the population count around schools is incorporated as an additional parameter for demand estimation.

4. Visualization

The results of infrastructure analysis are presented as maps displaying school locations, adjusted according to infrastructure proximity, coverage, visibility, or other parameters. By utilizing different layers of data, the outputs from connectivity ​analysis provide insights into the connectivity options available to schools. This supports cost analyses, helping to identify cost-effective methods for delivering connectivity.

Infrastructure Maps - Africa

Infrastructure Maps - Americas

Infrastructure Maps - ​Asia and the Pasific


Infrastructure Maps - Commonwealth of Independent States