
Page 56 - ITU Journal Future and evolving technologies Volume 2 (2021), Issue 5 – Internet of Everything
P. 56
ITU Journal on Future and Evolving Technologies, Volume 2 (2021), Issue 5
10 0 10 0
10 0
10
−20 8 8
8 20 −5
requency (GHz) 6 4 −40 Density (dB/Hz) requency (GHz) 6 4 30 Density (dB/Hz) requency (GHz) 6 4 −10 Density (dB/Hz)
−60
F −80 F 40 F −15
2 2
2
50
−100
0 60 0 −20
0
0 0.05 0.1 0.15 0.2 0.25 0 0.05 0.1 0.15 0.2 0.25
0 0.05 0.1 0.15 0.2 0.25
Time (ms) Time (ms) Time (ms)
(a) (b) (c)
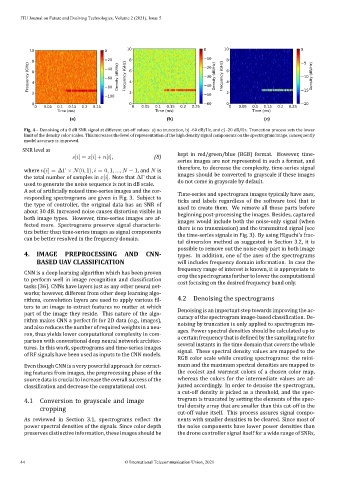
Fig. 4 – Denoising of a 0 dB SNR signal at different cut‑off values: a) no truncation, b) ‑60 dB/Hz, and c) ‑20 dB/Hz. Truncation process sets the lower
limit of the density color scales. This increases the level of representation of the high density signal components on the spectrogram image, consequently
model accuracy is improved.
SNR level as
[ ] = [ ] + [ ], (8) kept in red/green/blue (RGB) format. However, time‑
series images are not represented in such a format, and
therefore, to decrease the complexity, time‑series signal
where [ ] = ΔΓ × (0, 1), = 0, 1, ..., − 1, and is
the total number of samples in [ ]. Note that ΔΓ that is images should be converted to grayscale if these images
used to generate the noise sequence is not in dB scale. do not come in grayscale by default.
A set of arti icially noised time‑series images and the cor‑ Time‑series and spectrogram images typically have axes,
responding spectrograms are given in Fig. 3. Subject to ticks and labels regardless of the software tool that is
the type of controller, the original data has an SNR of used to create them. We remove all those parts before
about 30 dB. Increased noise causes distortion visible in beginning post‑processing the images. Besides, captured
both image types. However, time‑series images are af‑ images would include both the noise‑only signal (when
fected more. Spectrograms preserve signal characteris‑ there is no transmission) and the transmitted signal (see
tics better than time‑series images as signal components the time‑series signals in Fig. 3). By using Higuchi’s frac‑
can be better resolved in the frequency domain.
tal dimension method as suggested in Section 3.2, it is
possible to remove out the noise‑only part in both image
4. IMAGE PREPROCESSING AND CNN‑ types. In addition, one of the axes of the spectrograms
BASED UAV CLASSIFICATION will includes frequency domain information. In case the
frequency range of interest is known, it is appropriate to
CNN is a deep learning algorithm which has been proven
crop the spectrograms further to lower the computational
to perform well in image recognition and classi ication
cost focusing on the desired frequency band only.
tasks [36]. CNNs have layers just as any other neural net‑
works; however, different from other deep learning algo‑
4.2 Denoising the spectrograms
rithms, convolution layers are used to apply various il‑
ters to an image to extract features no matter at which
Denoising is an important step towards improving the ac‑
part of the image they reside. This nature of the algo‑
curacy of the spectrogram image‑based classi ication. De‑
rithm makes CNN a perfect it for 2D data (e.g., images),
noising by truncation is only applied to spectrogram im‑
and also reduces the number of required weights in a neu‑
ages. Power spectral densities should be calculated up to
ron, thus yields lower computational complexity in com‑
a certain frequencythat is de ined bythe sampling ratefor
parison with conventional deep neural network architec‑
several instants in the time domain that covers the whole
tures. In this work, spectrograms and time‑series images signal. These spectral density values are mapped to the
of RF signals have been used as inputs to the CNN models.
RGB color scale while creating spectrograms: the mini‑
Even though CNN is a very powerful approach for extract‑ mum and the maximum spectral densities are mapped to
ing features from images, the preprocessing phase of the the coolest and warmest colors of a chosen color map,
source data is crucial to increase the overall success of the whereas the colors for the intermediate values are ad‑
classi ication and decrease the computational cost. justed accordingly. In order to denoise the spectrogram,
a cut‑off density is picked as a threshold, and the spec‑
trogram is truncated by setting the elements of the spec‑
4.1 Conversion to grayscale and image
cropping tral density array that are smaller than this cut‑off to the
cut‑off value itself. This process assures signal compo‑
As reviewed in Section 3.1, spectrograms re lect the nents with smaller densities to be cleared. Since most of
power spectral densities of the signals. Since color depth the noise components have lower power densities than
preserves distinctive information, these images should be the drone controller signal itself for a wide range of SNRs,
44 © International Telecommunication Union, 2021