
Page 54 - ITU Journal Future and evolving technologies Volume 2 (2021), Issue 5 – Internet of Everything
P. 54
ITU Journal on Future and Evolving Technologies, Volume 2 (2021), Issue 5
0.2 0.2 0.2 0.2 0.2
0.1
Amplitude (Volts) -0.1 0 Amplitude (Volts) -0.1 0 Amplitude (Volts) -0.1 0 Amplitude (Volts) -0.1 0 Amplitude (Volts) -0.1 0
0.1
0.1
0.1
0.1
-0.2 -0.2 -0.2 -0.2 -0.2
0 0.05 0.1 0.15 0.2 0.25 0 0.05 0.1 0.15 0.2 0.25 0 0.05 0.1 0.15 0.2 0.25 0 0.05 0.1 0.15 0.2 0.25 0 0.05 0.1 0.15 0.2 0.25
Time (ms) Time (ms) Time (ms) Time (ms) Time (ms)
(a) (b) (c) (d) (e)
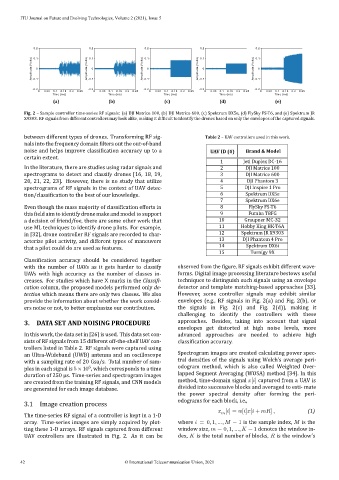
Fig. 2 – Sample controller time‑series RF signals: (a) DJI Matrice 100, (b) DJI Matrice 600, (c) Spektrum DX5e, (d) FlySky FS‑T6, and (e) Spektrum JR
X9303. RF signals from different controllers may look alike, making it dif icult to identify the drones based on only the envelopes of the captured signals.
between different types of drones. Transforming RF sig‑ Table 2 – UAV controllers used in this work.
nals into the frequency domain ilters out the out‑of‑band
noise and helps improve ication accuracy up to a UAV ID (#) Brand & Model
certain extent.
1 Jeti Duplex DC‑16
In the literature, there are studies using radar signals and 2 DJI Matrice 100
spectrograms to detect and classify drones [16, 18, 19, 3 DJI Matrice 600
20, 21, 22, 23]. However, there is no study that utilize 4 DJI Phantom 3
spectrograms of RF signals in the context of UAV detec‑ 5 DJI Inspire 1 Pro
tion/classi ication to the best of our knowledge. 6 Spektrum DX5e
7 Spektrum DX6e
Even though the mass majority of classi ication efforts in 8 FlySky FS‑T6
this ield aim to identify drone make and model to support 9 Futuba T8FG
10 Graupner MC‑32
a decision of friend/foe, there are some other work that
11 Hobby King HK‑T6A
use ML techniques to identify drone pilots. For example,
12 Spektrum JR X9303
in [32], drone controller RF signals are recorded to char‑
13 DJI Phantom 4 Pro
acterize pilot activity, and different types of maneuvers
that a pilot could do are used as features. 14 Spektrum DX6i
15 Turnigy 9X
ication accuracy should be considered together
with the number of UAVs as it gets harder to classify observed from the igure, RF signals exhibit different wave-
UAVs with high accuracy as the number of classes in‑ forms. Digital image processing literature bestows useful
creases. For studies which have X marks in the Classi i‑ techniques to distinguish such signals using an envelope
cation column, the proposed models performed only de‑ detector and template matching-based approaches [33].
tection which means there are only two classes. We also However, some controller signals may exhibit similar
provide the information about whether the work consid‑ envelopes (e.g., RF signals in Fig. 2(a) and Fig. 2(b), or
ers noise or not, to better emphasize our contribution. the signals in Fig. 2(c) and Fig. 2(d)), making it
challenging to identify the controllers with these
3. DAT A SET AND NOISING PROCEDURE approaches. Besides, taking into account that signal
envelopes get distorted at high noise levels, more
In this work, the data set in [26] is used. This data set con‑ advanced approaches are needed to achieve high
sists of RF signals from 15 different off‑the‑shelf UAV con‑ classi ication accuracy.
trollers listed in Table 2. RF signals were captured using
Spectrogram images are created calculating power spec‑
an Ultra‑Wideband (UWB) antenna and an oscilloscope
tral densities of the signals using Welch’s average peri‑
with a sampling rate of 20 Gsa/s. Total number of sam‑
6 odogram method, which is also called Weighted Over‑
ples in each signal is 5 × 10 , which corresponds to a time
lapped Segment Averaging (WOSA) method [34]. In this
duration of 250 µs. Time‑series and spectrogram images
method, time‑domain signal [ ] captured from a UAV is
are created from the training RF signals, and CNN models
are generated for each image database. divided into successive blocks and averaged to esti‑ mate
the power spectral density after forming the peri‑
odograms for each block, i.e.,
3.1 Image creation process
[ ] = [ ] [ + ] , (1)
The time‑series RF signal of a controller is kept in a 1‑D
array. Time‑series images are simply acquired by plot‑ where = 0, 1, ..., − 1 is the sample index, is the
ting these 1‑D arrays. RF signals captured from different window size, = 0, 1, ..., − 1 denotes the window in‑
UAV controllers are illustrated in Fig. 2. As it can be dex, is the total number of blocks, is the window’s
42 © International Telecommunication Union, 2021