
Page 58 - ITU Journal Future and evolving technologies Volume 2 (2021), Issue 5 – Internet of Everything
P. 58
ITU Journal on Future and Evolving Technologies, Volume 2 (2021), Issue 5
256 nodes
128 filters
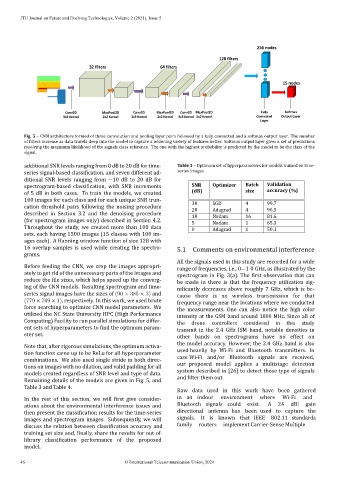
32 filters 64 filters
15 nodes
Conv2D MaxPool2D Conv2D MaxPool2D Conv2D MaxPool2D Fully Softmax
3x3 Kernel 2x2 Kernel 3x3 Kernel 2x2 Kernel 3x3 Kernel 2x2 Kernel Connected Output Layer
Layer
Fig. 5 – CNN architecture formed of three convolution and pooling layer pairs followed by a fully connected and a softmax output layer. The number
of ilters increase as data travels deep into the model to capture a widening variety of features better. Softmax output layer gives a set of predictions
resolving the maximum likelihood of the signals class reference. The one with the highest probability is predicted by the model to be the class of the
signal.
additional SNR levels ranging from 0 dB to 20 dB for time‑ Table 3 – Optimum set of hyperparameters for models trained on time‑
series images.
series signal‑based classi ication, and seven different ad‑
ditional SNR levels ranging from −10 dB to 20 dB for
SNR Optimizer Batch Validation
spectrogram‑based classi ication, with SNR increments
(dB) size accuracy (%)
of 5 dB in both cases. To train the models, we created
100 images for each class and for each unique SNR trun‑
30 SGD 4 99.7
cation threshold pairs following the noising procedure
20 Adagrad 4 96.5
described in Section 3.2 and the denoising procedure
10 Nadam 16 81.6
(for spectrogram images only) described in Section 4.2.
5 Nadam 1 65.3
Throughout the study, we created more than 100 data
0 Adagrad 1 50.1
sets, each having 1500 images (15 classes with 100 im‑
ages each). A Hanning window function of size 128 with
16 overlap samples is used while creating the spectro‑ 5.1 Comments on environmental interference
grams.
All the signals used in this study are recorded for a wide
Before feeding the CNN, we crop the images appropri‑
range of frequencies, i.e., 0−1 0 GHz, as illustrated by the
ately to get rid of the unnecessary parts of the images and
spectrogram in Fig. 3(a). The irst observation that can
reduce the ile sizes, which helps speed up the converg‑
be made in there is that the frequency utilization sig‑
ing of the CNN models. Resulting spectrogram and time‑
ni icantly decreases above roughly 7 GHz, which is be‑
series signal images have the sizes of (90 × 385 × 3) and
cause there is no wireless transmission for that
(779 × 769 × 1), respectively. In this work, we used brute
frequency range near the locations where we conducted
force searching to optimize CNN model parameters. We
the measurements. One can also notice the high color
utilized the NC State University HPC (High Performance
intensity at the GSM band around 1800 MHz. Since all of
Computing) Facility to run parallel simulations for differ‑
the drone controllers considered in this study
ent sets of hyperparameters to ind the optimum param‑ transmit in the 2.4 GHz ISM band, notable densities in
eter set.
other bands on spectrograms have no effect on
the model accuracy. However, the 2.4 GHz band is also
Note that, after rigorous simulations, the optimum activa‑
used heavily by Wi‑Fi and Bluetooth transmitters. In
tion function came up to be ReLu for all hyperparameter
case Wi‑Fi and/or Bluetooth signals are received,
combinations. We also used single stride in both direc‑
our proposed model applies a multistage detection
tions on images with no dilation, and valid padding for all
system described in [26] to detect those type of signals
models created regardless of SNR level and type of data.
and ilter them out.
Remaining details of the models are given in Fig. 5, and
Table 3 and Table 4.
Raw data used in this work have been gathered
In the rest of this section, we will irst give consider‑ in an indoor environment where Wi‑Fi and
ations about the environmental interference issues and Bluetooth signals could exist. A 24 dBi gain
then present the classi ication results for the time‑series directional antenna has been used to capture the
images and spectrogram images. Subsequently, we will signals. It is known that IEEE 802.11 standards
discuss the relation between classi ication accuracy and family routers implement Carrier‑Sense Multiple
training set size and, inally, share the results for out‑of‑
classif proposed
model.
46 © International Telecommunication Union, 2021