
Page 59 - ITU Journal Future and evolving technologies Volume 2 (2021), Issue 5 – Internet of Everything
P. 59
ITU Journal on Future and Evolving Technologies, Volume 2 (2021), Issue 5
Table 4 – Optimum set of hyperparameters for models trained on spec‑ 100
trogram images.
80
SNR Cut‑off Optimizer Batch Validation
(dB) level size accuracy 60 Decreasing SNR -10 dB
(dB/Hz) (%) Accuracy (%) -5 dB
0 dB
30 −100 Adamax 8 99.7 40 5 dB
10 dB
20 −90 Nadam 2 99.7 15 dB
20
15 −10 Adam 32 100.0 20 dB
10 −10 Nadam 2 100.0 30 dB
0
5 −10 Adam 4 99.7 − 120 − 100 − 80 − 60 − 40 − 20
Cut-off threshold (dB/Hz)
0 −10 Nadam 8 99.5
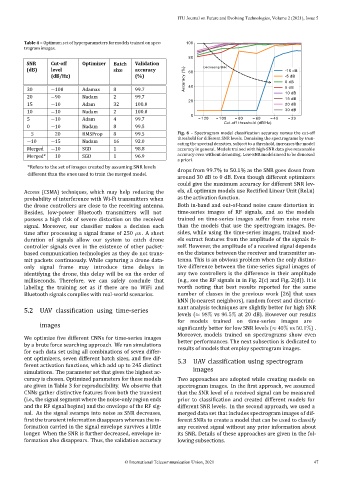
−5 −20 RMSProp 8 99.5 Fig. 6 – Spectrogram model classi ication accuracy versus the cut‑off
threshold for different SNR levels. Denoising the spectrograms by trun‑
−10 −15 Nadam 16 92.0
cating the spectral densities, subject to a threshold, increases the model
Merged −10 SGD 1 98.8 accuracy in general. Models trained with high‑SNR data give reasonable
Merged* −10 SGD 1 96.9 accuracy even without denoising. Low‑SNR models need to be denoised
a priori.
*Refers to the set of images created by assuming SNR levels
drops from 99.7% to 50.1% as the SNR goes down from
different than the ones used to train the merged model.
around 30 dB to 0 dB. Even though different optimizers
could give the maximum accuracy for different SNR lev‑
Access (CSMA) techniques, which may help reducing the els, all optimum models use Recti ied Linear Unit (ReLu)
probability of interference with Wi‑Fi transmitters when as the activation function.
the drone controllers are close to the receiving antenna. Both in‑band and out‑of‑band noise cause distortion in
Besides, low‑power Bluetooth transmitters will not time‑series images of RF signals, and so the models
possess a high risk of severe distortion on the received trained on time‑series images suffer from noise more
signal. Moreover, our classi ier makes a decision each than the models that use the spectrogram images. Be‑
time after processing a signal frame of 250 s . A short sides, while using the time‑series images, trained mod‑
duration of signals allow our system to catch drone els extract features from the amplitude of the signals it‑
controller signals even in the existence of other packet‑ self. However, the amplitude of a received signal depends
based communication technologies as they do not trans‑ on the distance between the receiver and transmitter an‑
mit packets continuously. While capturing a drone data‑ tenna. This is an obvious problem when the only distinc‑
only signal frame may introduce time delays in tive difference between the time‑series signal images of
identifying the drone, this delay will be on the order of any two controllers is the difference in their amplitude
milliseconds. Therefore, we can safely conclude that (e.g., see the RF signals in in Fig. 2(c) and Fig. 2(d)). It is
labeling the training set as if there are no WiFi and worth noting that best results reported for the same
Bluetooth signals complies with real‑world scenarios. number of classes in the previous work [26] that uses
kNN (k‑nearest neighbors), random forest and discrimi‑
5.2 UAV classi ication using time‑series nant analysis techniques are slightly better for high SNR
levels (≈ 98% vs 96.5% at 20 dB). However our results
for models trained on time‑series images are
images
signi icantly better for low SNR levels (≈ 40% vs 50.1%) .
Moreover, models trained on spectrograms show even
We optimize ive different CNNs for time‑series images
by a brute force searching approach. We ran simulations better performances. The next subsection is dedicated to
results of models that employ spectrogram images.
for each data set using all combinations of seven differ‑
ent optimizers, seven different batch sizes, and ive dif‑ 5.3 UAV classi ication using spectrogram
ferent activation functions, which add up to 245 distinct images
simulations. The parameter set that gives the highest ac‑
curacy is chosen. Optimized parameters for these models Two approaches are adopted while creating models on
are given in Table 3 for reproducibility. We observe that spectrogram images. In the irst approach, we assumed
CNNs gather distinctive features from both the transient that the SNR level of a received signal can be measured
(i.e., the signal segment where the noise‑only region ends prior to ication and created different models for
and the RF signal begins) and the envelope of the RF sig‑ different SNR levels. In the second approach, we used a
nal. As the signal swamps into noise as SNR decreases, merged data set that includes spectrogram images of dif‑
irst the transient information disappears whereas the in‑ ferent SNRs to create a model that can be used to classify
formation carried in the signal envelope survives a little any received signal without any prior information about
longer. When the SNR is further decreased, envelope in‑ its SNR. Details of these approaches are given in the fol-
formation also disappears. Thus, the validation accuracy lowing subsections.
© International Telecommunication Union, 2021 47