
Page 60 - ITU Journal Future and evolving technologies Volume 2 (2021), Issue 5 – Internet of Everything
P. 60
ITU Journal on Future and Evolving Technologies, Volume 2 (2021), Issue 5
5.3.1 Models with single SNR training sets 200
1 199 0 0 0 0 0 0 0 0 1 0 0 0 0 0
We have created eight models for eight different SNR lev‑
2 1 194 0 0 3 0 0 0 0 0 0 0 2 0 0
els that are truncated at their own optimum levels. To
3 0 0 199 0 0 0 0 0 0 0 0 0 1 0 0
use this approach, the SNR of the received signal should 160
4 1 0 0 197 0 0 0 0 0 0 0 0 0 0 2
be calculated irst, and then the model that has the clos‑
est SNR should be called to perform the classi ication. We 5 0 0 0 0 199 0 0 0 0 0 0 0 1 0 0
observed that all of the models give their highest accu‑ 6 0 0 0 0 0 200 0 0 0 0 0 0 0 0 0
racy with the ReLu activation function. The sensitivity of 7 0 0 0 0 0 0 200 0 0 0 0 0 0 0 0 120
the validation accuracy to a single output was found to 0 0 0 0 0 0 0 199 0 1 0 0 0 0 0
−1 Predicted Classes 8
be 0.27% sample . Optimized parameters of the 0 0 0 0 0 0 0 0 200 0 0 0 0 0 0
models using spectrogram images are given in Table 4. It 9 80
is seen that the lowest accuracy belongs to the SNR level 10 5 0 0 0 0 1 0 0 0 194 0 0 0 0 0
−10 dB among the individual sets. Performances of all 11 0 0 0 0 0 0 0 0 0 0 200 0 0 0 0
the other models can be considered almost perfect. It 12 0 0 0 0 0 0 0 0 0 0 3 197 0 0 0
is also observed from Table 4 that the optimum cut‑off 0 1 14 0 2 0 0 0 0 0 0 0 183 0 0 40
levels are different for different SNR levels. 13
14 2 0 0 0 0 0 0 0 0 1 0 0 0 197 0
Classi ication accuracy at different truncation thresholds 15 0 0 0 0 0 0 0 0 0 2 0 0 0 2 196
for different SNR levels are given in Fig. 6. By considering 0
1 2 3 4 5 6 7 8 9 10 11 12 13 14 15
this igure and Table 4 together, one can conclude that, in Actual Classes
general, the ication accuracy tends to increase
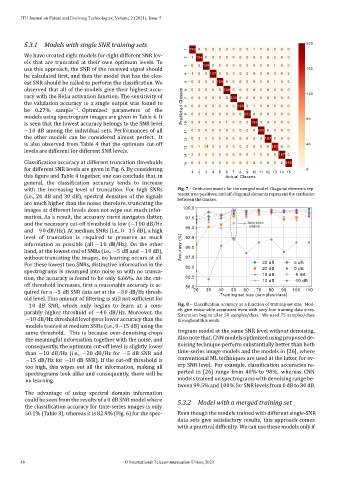
with the increasing level of truncation. For high SNRs Fig. 7 – Confusion matrix for the merged model. Diagonal elements rep‑
resent true positives, and off‑diagonal elements represent the confusion
(i.e., 20 dB and 30 dB), spectral densities of the signals
between the classes.
are much higher than the noise; therefore, truncating the
100.0
images at different levels does not wipe out much infor‑
mation. As a result, the accuracy curve navigates latter, 97.5
and the necessary cut‑off threshold is low (−100 dB/Hz Saturation
begins
95.0
and −90 dB/Hz). At medium SNRs (i.e., 0−15 dB), a high
Accuracy (%) 90.0
level of truncation is required to preserve as much 92.5
information as possible (all −10 dB/Hz). On the other
hand, at the lowest end of SNRs (i.e., −5 dB and −10 dB),
without truncating the images, no learning occurs at all. 87.5
For these lowest two SNRs, distinctive information in the 30 dB 5 dB
85.0 20 dB 0 dB
spectrograms is swamped into noise so with no trunca‑
15 dB -5 dB
tion, the accuracy is found to be only 6.66%. As the cut‑ 82.5
10 dB -10 dB
off threshold increases, irst a reasonable accuracy is ac‑ 80.0
20 30 40 50 60 70 80 90 100 110
quired for a −5 dB SNR data set at the −80 dB/Hz thresh‑
Training set size (samples/class)
old level. This amount of iltering is still not suf icient for
−10 dB SNR, which only begins to learn at a com‑ Fig. 8 – Classi ication accuracy as a function of training set size. Mod‑
parably higher threshold of −40 dB/Hz. Moreover, the els give reasonable accuracies even with very low training data sizes.
Saturation begins after 50 samples/class. We used 75 samples/class
−10 dB/Hz threshold level gives lower accuracy than the throughout this work.
models trained at medium SNRs (i.e., 0−15 dB) using the
same threshold. This is because over‑denoising chops trogram model at the same SNR level without denoising.
the meaningful information together with the noise, and Also note that, CNN models optimized using proposed de‑
consequently, the optimum cut‑off level is slightly lower noising technique perform substantially better than both
than −10 dB/Hz (i.e., −20 dB/Hz for −5 dB SNR and time‑series image models and the models in [26], where
−15 dB/Hz for −10 dB SNR). If the cut‑off threshold is conventional ML techniques are used at the latter, for ev‑
too high, this wipes out all the information, making all ery SNR level. For example, classi ication accuracies re‑
spectrograms look alike and consequently, there will be ported in [26] range from 40% to 98%, whereas CNN
no learning. models trained on spectrograms with denoising range be‑
tween 99.5% and 100% for SNR levels from 0 dB to 30 dB.
The advantage of using spectral domain information
could be seen from the results of a 0 dB SNR model where 5.3.2 Model with a merged training set
the classi ication accuracy for time‑series images is only
50.1% (Table 3), whereas it is 82.9% (Fig. 6) for the spec‑ Even though the models trained with different single‑SNR
data sets give satisfactory results, this approach comes
with a practical dif iculty. We can use these models only if
48 © International Telecommunication Union, 2021