
Page 66 - ITU Journal Future and evolving technologies Volume 3 (2022), Issue 2 – Towards vehicular networks in the 6G era
P. 66
ITU Journal on Future and Evolving Technologies, Volume 3 (2022), Issue 2
280 280
TACA TACA
260 260
Probabilistic (0.3) Probabilistic (0.3)
240 Generate-at-will 240 Generate-at-will
TAC 220 TAC 220
200
200
180 180
160 160
140 140
50 75 100 125 150 50 75 100 125 150
τ g (s) τ g (s)
(a) Uniform time interval (b) Poisson time interval
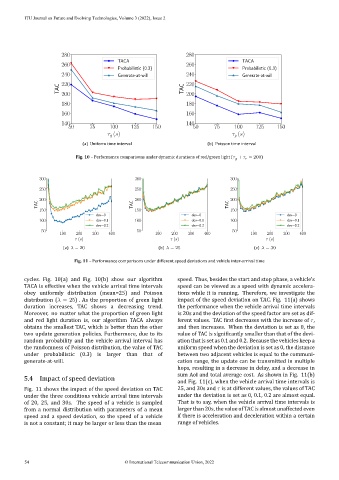
Fig. 10 – Performance comparisons under dynamic durations of red/green light ( + = 200)
300 300 300
250 250 250
200 200 200
TAC TAC TAC
150 150 150
dev=0 dev=0 dev=0
100 dev=0.1 100 dev=0.1 100 dev=0.1
dev=0.2 dev=0.2 dev=0.2
50 50 50
100 200 300 400 100 200 300 400 100 200 300 400
τ (s) τ (s) τ (s)
(a) = 20 (b) = 25 (c) = 30
Fig. 11 – Performance comparisons under different speed deviations and vehicle inter‑arrival time
cycles. Fig. 10(a) and Fig. 10(b) show our algorithm speed. Thus, besides the start and stop phase, a vehicle’s
TACA is effective when the vehicle arrival time intervals speed can be viewed as a speed with dynamic accelera‑
obey uniformly distribution (mean=25) and Poisson tions while it is running. Therefore, we investigate the
distribution ( = 25) . As the proportion of green light impact of the speed deviation on TAC. Fig. 11(a) shows
duration increases, TAC shows a decreasing trend. the performance when the vehicle arrival time intervals
Moreover, no matter what the proportion of green light is 20s and the deviation of the speed factor are set as dif‑
and red light duration is, our algorithm TACA always ferent values. TAC irst decreases with the increase of ,
obtains the smallest TAC, which is better than the other and then increases. When the deviation is set as 0, the
two update generation policies. Furthermore, due to its value of TAC is signi icantly smaller than that of the devi‑
random probability and the vehicle arrival interval has ation that is set as 0.1 and 0.2. Because the vehicles keep a
the randomness of Poisson distribution, the value of TAC uniform speed when the deviation is set as 0, the distance
under probabilistic (0.3) is larger than that of between two adjacent vehicles is equal to the communi‑
generate‑at‑will. cation range, the update can be transmitted in multiple
hops, resulting in a decrease in delay, and a decrease in
sum AoI and total average cost. As shown in Fig. 11(b)
5.4 Impact of speed deviation and Fig. 11(c), when the vehicle arrival time intervals is
Fig. 11 shows the impact of the speed deviation on TAC 25, and 30s and is at different values, the values of TAC
under the three conditions vehicle arrival time intervals under the deviation is set as 0, 0.1, 0.2 are almost equal.
of 20, 25, and 30s. The speed of a vehicle is sampled That is to say, when the vehicle arrival time intervals is
from a normal distribution with parameters of a mean larger than 20s, the value of TAC is almost unaffected even
speed and a speed deviation, so the speed of a vehicle if there is acceleration and deceleration within a certain
is not a constant; it may be larger or less than the mean range of vehicles.
54 © International Telecommunication Union, 2022