
Page 61 - ITU Journal Future and evolving technologies Volume 3 (2022), Issue 2 – Towards vehicular networks in the 6G era
P. 61
ITU Journal on Future and Evolving Technologies, Volume 3 (2022), Issue 2
Table 1 – Description of frequently‑used notations
Notation Description
Generation interval time of updates at source.
The interval time of arrival vehicles.
, The ℎ road with the length of .
Cycle time of a traf ic light.
( ) Duration of a red (green) light.
The moving speed of vehicles.
Wireless communication range.
Δ /Δ Average AoI / Sum AoI of each cycle.
/ ′ Generation / receiving time of ℎ update.
information:
metric, has inspired a series of studies on the analysis
and optimization of timeliness performance. Saurav et
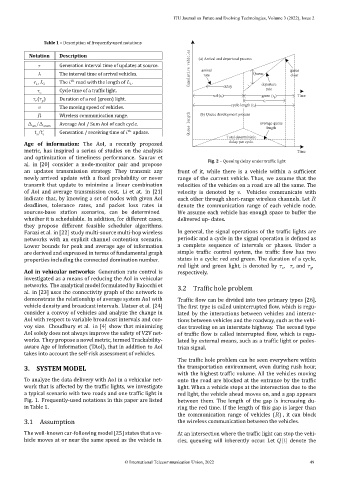
Fig. 2 – Queuing delay under traf ic light
al. in [20] consider a node‑monitor pair and propose
an updates transmission strategy. They transmit any front of it, while there is a vehicle within a suf icient
newly arrived update with a ixed probability or never range of the current vehicle. Thus, we assume that the
transmit that update to minimize a linear combination velocities of the vehicles on a road are all the same. The
of AoI and average transmission cost. Li et at. in [21] velocity is denoted by . Vehicles communicate with
indicate that, by knowing a set of nodes with given AoI each other through short‑range wireless channels. Let
deadlines, tolerance rates, and packet loss rates in denote the communication range of each vehicle node.
sources‑base station scenarios, can be determined We assume each vehicle has enough space to buffer the
whether it is schedulable. In addition, for different cases, delivered up‑ dates.
they propose different feasible scheduler algorithms.
Farazi et al. in [22] study multi-source multi‑hop wireless In general, the signal operations of the ic lights are
networks with an explicit channel contention scenario. periodic and a cycle in the signal operation is de ined as
Lower bounds for peak and average age of information a complete sequence of intervals or phases. Under a
are derived and expressed in terms of fundamental graph simple traf ic control system, the traf ic low has two
properties including the connected domination number. states in a cycle: red and green. The duration of a cycle,
red light and green light, is denoted by , and ,
AoI in vehicular networks: Generation rate control is respectively.
investigated as a means of reducing the AoI in vehicular
networks. The analytical model formulated by Baiocchi et
3.2 Traf ic hole problem
al. in [23] uses the connectivity graph of the network to
demonstrate the relationship of average system AoI with Traf ic low can be divided into two primary types [26].
vehicle density and broadcast intervals. Llatser et al. [24] The irst type is called uninterrupted low, which is regu‑
consider a convoy of vehicles and analyze the change in lated by the interactions between vehicles and interac‑
AoI with respect to variable broadcast intervals and con‑ tions between vehicles and the roadway, such as the vehi‑
voy size. Choudhury et al. in [4] show that minimizing cles traveling on an interstate highway. The second type
AoI solely does not always improve the safety of V2V net‑ of ic low is called interrupted low, which is regu‑
works. They propose a novel metric, termed Trackability‑ lated by external means, such as a traf ic light or pedes‑
aware Age of Information (TAoI), that in addition to AoI trian signal.
takes into account the self‑risk assessment of vehicles.
The traf ic hole problem can be seen everywhere within
3. SYSTEM MODEL the transportation environment, even during rush hour,
with the highest traf ic volume. All the vehicles moving
To analyze the data delivery with AoI in a vehicular net‑ onto the road are blocked at the entrance by the traf ic
work that is affected by the traf ic lights, we investigate light. When a vehicle stops at the intersection due to the
a typical scenario with two roads and one traf ic light in red light, the vehicle ahead moves on, and a gap appears
Fig. 1. Frequently‑used notations in this paper are listed between them. The length of the gap is increasing du‑
in Table 1. ring the red time. If the length of this gap is larger than
the communication range of vehicles ( ) , it can block
3.1 Assumption the wireless communication between the vehicles.
The well‑known car‑following model [25] states that a ve‑ At an intersection where the traf ic light can stop the vehi-
hicle moves at or near the same speed as the vehicle in cles, queueing will inherently occur. Let ( ) denote the
© International Telecommunication Union, 2022 49