
Page 65 - ITU Journal Future and evolving technologies Volume 3 (2022), Issue 2 – Towards vehicular networks in the 6G era
P. 65
ITU Journal on Future and Evolving Technologies, Volume 3 (2022), Issue 2
400 1500 400
λ = 15s λ = 15s λ = 15s
350
λ = 20s 1250 λ = 20s 320 λ = 20s
300 λ = 25s λ = 25s
λ = 30s 1000 λ = 25s
250
∆ av 200 TACA hops 750 λ = 30s TAC 240 λ = 30s
TACA
Age 150 Total 160
100 500 80
250
50
0 0 0
80 160 240 320 400 80 160 240 320 400 0 80 160 240 320 400
τ (s) τ (s) τ(s)
(a) Average AoI (b) Total transmissions (c) Total average cost
Fig. 8 – Analytical model compared with simulations
280 280 280
TACA TACA TACA
260 Probabilistic (0.3) 260 Probabilistic (0.3) 260 Probabilistic (0.3)
240 Generate-at-will 240 Generate-at-will 240 Generate-at-will
TAC 220 TAC 220 TAC 220
200 200 200
180 180 180
160 160 160
50 75 100 125 150 50 75 100 125 150 50 75 100 125 150
τ r or τ g (s) τ r or τ g (s) τ r or τ g (s)
(a) Uniform time interval (b) Poisson time interval (c) Deviation of speed
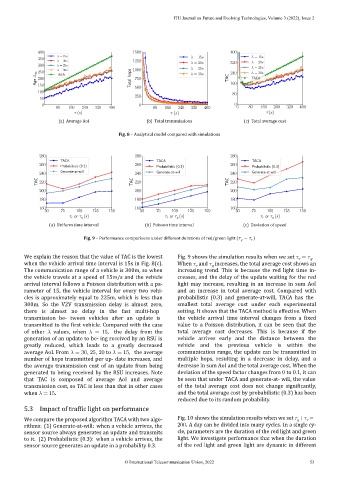
Fig. 9 – Performance comparisons under different durations of red/green light ( = )
We explain the reason that the value of TAC is the lowest Fig. 9 shows the simulation results when we set = .
when the vehicle arrival time interval is 15s in Fig. 8(c). When and increases, the total average cost shows an
The communication range of a vehicle is 300m, so when increasing trend. This is because the red light time in‑
the vehicle travels at a speed of 15m/s and the vehicle creases, and the delay of the update waiting for the red
arrival interval follows a Poisson distribution with a pa‑ light may increase, resulting in an increase in sum AoI
rameter of 15, the vehicle interval for every two vehi‑ and an increase in total average cost. Compared with
cles is approximately equal to 225m, which is less than probabilistic (0.3) and generate‑at‑will, TACA has the
300m. So the V2V transmission delay is almost zero, smallest total average cost under each experimental
there is almost no delay in the fast multi‑hop setting. It shows that the TACA method is effective. When
transmission be‑ tween vehicles after an update is the vehicle arrival time interval changes from a ixed
transmitted to the irst vehicle. Compared with the case value to a Poisson distribution, it can be seen that the
of other values, when = 15, the delay from the total average cost decreases. This is because if the
generation of an update to be‑ ing received by an RSU is vehicle arrives early and the distance between the
greatly reduced, which leads to a greatly decreased vehicle and the previous vehicle is within the
average AoI. From = 30, 25, 20 to = 15, the average communication range, the update can be transmitted in
number of hops transmitted per up‑ date increases, and multiple hops, resulting in a decrease in delay, and a
the average transmission cost of an update from being decrease in sum AoI and the total average cost. When the
generated to being received by the RSU increases. Note deviation of the speed factor changes from 0 to 0.1, it can
that TAC is composed of average AoI and average be seen that under TACA and generate‑at‑ will, the value
transmission cost, so TAC is less than that in other cases of the total average cost does not change icantly,
when = 15. and the total average cost by probabilistic (0.3) has been
reduced due to its random probability.
5.3 Impact of traf ic light on performance
Fig. 10 shows the simulation results when we set + =
We compare the proposed algorithm TACA with two algo‑
rithms: (1) Generate‑at‑will: when a vehicle arrives, the 200. A day can be divided into many cycles. In a single cy‑
sensor source always generates an update and transmits cle, parameters are the duration of the red light and green
to it. (2) Probabilistic (0.3): when a vehicle arrives, the light. We investigate performance that when the duration
sensor source generates an update in a probability 0.3. of the red light and green light are dynamic in different
© International Telecommunication Union, 2022 53