
Page 67 - ITU Journal Future and evolving technologies Volume 3 (2022), Issue 2 – Towards vehicular networks in the 6G era
P. 67
ITU Journal on Future and Evolving Technologies, Volume 3 (2022), Issue 2
240 400
λ = 20
220 350 λ = 25
λ = 30
200 300
TACA λ ∼ Pois(20)
TAC 180 Probabilistic (0.3) TAC 250 λ ∼ Pois(25)
Generate-at-will λ ∼ Pois(30)
160 200
140 150
120 100
50 75 100 125 150 100 200 300 400
λ (s) τ (s)
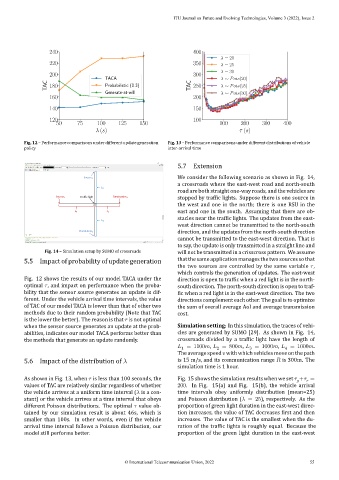
Fig. 12 – Performance comparisons under different update generation Fig. 13 – Performance comparisons under different distributions of vehicle
policy inter‑arrival time
5.7 Extension
We consider the following scenario as shown in Fig. 14,
Source 2
a crossroads where the east‑west road and north‑south
3
road are both straight one‑way roads, and the vehicles are
Traffic light
Source 1 Destination 1 stopped by traf ic lights. Suppose there is one source in
the west and one in the north; there is one RSU in the
1 2 east and one in the south. Assuming that there are ob‑
stacles near the traf ic lights. The updates from the east‑
4
west direction cannot be transmitted to the north‑south
direction, and the updates from the north‑south direction
Destination 2
cannot be transmitted to the east‑west direction. That is
to say, the update is only transmitted in a straight line and
Fig. 14 – Simulation setup by SUMO of crossroads will not be transmitted in a crisscross pattern. We assume
5.5 Impact of probability of update generation that the same application manages the two sources so that
the two sources are controlled by the same variable ,
which controls the generation of updates. The east‑west
Fig. 12 shows the results of our model TACA under the direction is open to traf ic when a red light is in the north‑
optimal , and impact on performance when the proba‑ south direction. The north‑south direction is open to traf‑
bility that the sensor source generates an update is dif‑ ic when a red light is in the east‑west direction. The two
ferent. Under the vehicle arrival time intervals, the value directions complement each other. The goal is to optimize
of TAC of our model TACA is lower than that of other two the sum of overall average AoI and average transmission
methods due to their random probability (Note that TAC cost.
is the lower the better). The reason is that is not optimal
when the sensor source generates an update at the prob‑ Simulation setting: In this simulation, the traces of vehi‑
abilities, indicates our model TACA performs better than cles are generated by SUMO [29]. As shown in Fig. 14,
the methods that generate an update randomly. crossroads divided by a tr ic light have the length of
= 1100 , = 800 , = 1000 , = 1000 .
1
4
3
2
The average speed with which vehicles move on the path
5.6 Impact of the distribution of is 15 m/s, and its communication range is 300m. The
simulation time is 1 hour.
As shown in Fig. 13, when is less than 100 seconds, the Fig. 15 shows the simulation results when we set + =
values of TAC are relatively similar regardless of whether 200. In Fig. 15(a) and Fig. 15(b), the vehicle arrival
the vehicle arrives at a uniform time interval ( is a con‑ time intervals obey uniformly distribution (mean=25)
stant) or the vehicle arrives at a time interval that obeys and Poisson distribution ( = 25), respectively. As the
different Poisson distributions. The optimal value ob‑ proportion of green light duration in the east‑west direc‑
tained by our simulation result is about 46s, which is tion increases, the value of TAC decreases irst and then
smaller than 100s. In other words, even if the vehicle increases. The value of TAC is the smallest when the du‑
arrival time interval follows a Poisson distribution, our ration of the traf ic lights is roughly equal. Because the
model still performs better. proportion of the green light duration in the east‑west
© International Telecommunication Union, 2022 55