Page 63 - ITU Journal Future and evolving technologies Volume 3 (2022), Issue 2 – Towards vehicular networks in the 6G era
P. 63

ITU Journal on Future and Evolving Technologies, Volume 3 (2022), Issue 2


                                                                       age                      up to peak
                                                                                                drop down
                           (   ) =    (   ) + Δ (   )  (1)                      S r             steady


                                                                                             S g
          where    (  ) denotes the average transmission cost, and
                     
          Δ (  ) denotes average AoI.
               
                                                                                                      time
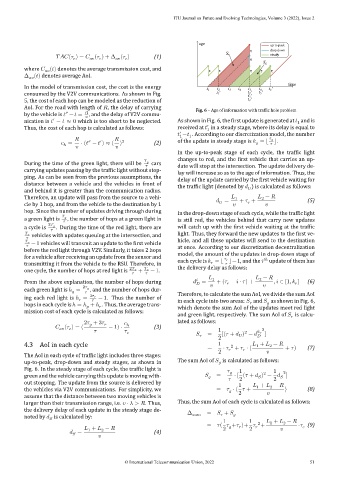
          In the model of transmission cost, the cost is the energy       t 1  t 2  t 3  t 4  t 5  t 6  t 6'
          consumed by the V2V communications. As shown in Fig.               t 1'       t 2'  t 5'
                                                                                        t 3'
          5, the cost of each hop can be modeled as the reduction of                    t 4'
          AoI. For the road with length of   , the delay of carrying  Fig. 6 – Age of information with traf ic hole problem
                        ″
          by the vehicle is    −    =     , and the delay of V2V commu‑
                                 
                    ′
          nication is    −    ≈ 0 which is too short to be neglected.  As shown in Fig. 6, the  irst update is generated at    and is
                                                                                                         1
                                                                          ′
          Thus, the cost of each hop is calculated as follows:  received at    in a steady stage, where its delay is equal to
                                                                          1
                                                                ′
                                                                  −   . According to our discretization model, the number
                                                                1
                                                                   1
                                                               of the update in steady stage is    = ⌊       
                                ″
                                    ′
                         =      ⋅ (   −    ) ≈ (      ) 2  (2)                                      ⌋.
                       ℎ
                                                               In the up‑to‑peak stage of each cycle, the traf ic light
                                                               changes to red, and the  irst vehicle that carries an up‑
          During the time of the green light, there will be         cars  date will stop at the intersection. The update delivery de‑
                                                      
          carrying updates passing by the traf ic light without stop‑  lay will increase so as to the age of information. Thus, the
          ping. As can be seen from the previous assumptions, the  delay of the update carried by the  irst vehicle waiting for
          distance between a vehicle and the vehicles in front of  the traf ic light (denoted by    ) is calculated as follows:
          and behind it is greater than the communication radius.                         
          Therefore, an update will pass from the source to a vehi‑             =     1  +    +     −        (5)
                                                                                             2
          cle by 1 hop, and from the vehicle to the destination by 1                            
          hop. Since the number of updates driving through during  In the drop‑down stage of each cycle, while the traf ic light
          a green light is         , the number of hops at a green light in  is still red, the vehicles behind that carry new updates
                         
          a cycle is  2       . During the time of the red light, there are  will catch up with the  irst vehicle waiting at the traf ic
                     
                 vehicles with updates queuing at the intersection, and  light. Thus, they forward the new updates to the  irst ve‑
            
                 − 1 vehicles will transmit an update to the  irst vehicle  hicle, and all these updates will send to the destination
                                                               at once. According to our discretization decentralization
          before the red light through V2V. Similarly, it takes 2 hops
          for a vehicle after receiving an update from the sensor and  model, the amount of the updates in drop‑down stage of
                                                                                                ℎ


          transmitting it from the vehicle to the RSU. Therefore, in  each cycle is    = ⌊ ⌋−1, and the     update of them has
          one cycle, the number of hops at red light is  2       +         −1.  the delivery delay as follows:
                                                 
                                                      
                                                                             1                −   
                                                                        
                                                                                            2
          From the above explanation, the number of hops during         =      + (   −    ⋅   ) +      ,    ∈ [1,    ]  (6)


          each green light is ℎ =  2      , and the number of hops dur‑
                            
                                 
          ing each red light is ℎ =  3       − 1. Thus the number of  Therefore, to calculate the sum AoI, we divide the sum AoI
                               
                                                               in each cycle into two areas:    and    as shown in Fig. 6,


          hops in each cycle is ℎ = ℎ + ℎ . Thus, the average trans‑  which denote the sum AoI of the updates meet red light
                                      
                                 
          mission cost of each cycle is calculated as follows:
                                                               and green light, respectively. The sum AoI of    is calcu‑
                                                                                                         
                               2   + 3                         lated as follows:
                       (   ) = (              − 1) ⋅     ℎ     (3)        =   1  [(   +    ) −           2 ]
                           
                          
                                                                                       2
                                                                                             
          4.3 AoI in each cycle                                               2 1  2         +    −   
                                                                                                2
                                                                                           1
                                                                          =    ⋅        +    ⋅ (     +   )   (7)
                                                                                        
                                                                              2                  
          The AoI in each cycle of traf ic light includes three stages:
          up‑to‑peak, drop‑down and steady stages, as shown in  The sum AoI of    is calculated as follows:
                                                                                
          Fig. 6. In the steady stage of each cycle, the traf ic light is               1        1
                                                                                              2
          green and the vehicle carrying this update is moving with‑            =      ⋅ [ (   +    ) −       2 ]
                                                                                              
                                                                                     2
                                                                                                 2
          out stopping. The update from the source is delivered by                   1       +    −   
          the vehicles via V2V communications. For simplicity, we            =    ⋅ (    +  1     2  )       (8)
                                                                                   
                                                                                     2
          assume that the distance between two moving vehicles is
          larger than their transmission range, i.e.    ⋅    >   . Thus,  Thus, the sum AoI of each cycle is calculated as follows:
          the delivery delay of each update in the steady stage de‑  Δ    =    +   
          noted by    is calculated by:                                          1       1       +    −   
                    
                                                                                            2
                                                                          =   (    +   )+    +  1   2     ⋅   (9)
                                  +    −                                       2          2                  
                                1
                                     2
                            =                          (4)
                             
                                             © International Telecommunication Union, 2022                    51
   58   59   60   61   62   63   64   65   66   67   68