
Page 53 - ITU Journal Future and evolving technologies Volume 2 (2021), Issue 4 – AI and machine learning solutions in 5G and future networks
P. 53
ITU Journal on Future and Evolving Technologies, Volume 2 (2021), Issue 4
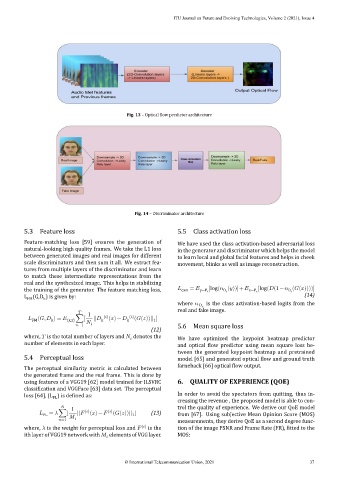
Fig. 13 – Optical low predictor architecture
Fig. 14 – Discriminator architecture
5.3 Feature loss 5.5 Class activation loss
Feature‑matching loss [59] ensures the generation of We have used the class activation‑based adversarial loss
natural‑looking high quality frames. We take the L1 loss in the generator and discriminator which helps the model
between generated images and real images for different to learn local and global facial features and helps in cheek
scale discriminators and then sum it all. We extract fea‑ movement, blinks as well as image reconstruction.
tures from multiple layers of the discriminator and learn
to match these intermediate representations from the
real and the synthesized image. This helps in stabilizing
the training of the generator. The feature matching loss, cam = y∼P t [log( ( ))]+ x∼P s [log( (1− ( ( ))))]
D t
D t
L (G,D ) is given by: (14)
k
FM
where is the class activation‑based logits from the
real and fake image.
1
( , ) = (x,z) ∑[ || k ( ) ( )− k ( ) ( ( ))|| ]
k
1
FM
=1 i 5.6 Mean square loss
(12)
where, is the total number of layers and denotes the We have optimized the keypoint heatmap predictor
number of elements in each layer. and optical low predictor using mean square loss be‑
tween the generated keypoint heatmap and pretrained
5.4 Perceptual loss model [65] and generated optical low and ground truth
farneback [66] optical low output.
The perceptual similarity metric is calculated between
the generated frame and the real frame. This is done by
using features of a VGG19 [62] model trained for ILSVRC 6. QUALITY OF EXPERIENCE (QOE)
classi ication and VGGFace [63] data set. The perceptual
loss [64], (L ) is de ined as: In order to avoid the spectators from quitting, thus in‑
PL
creasing the revenue , the proposed model is able to con‑
1 trol the quality of experience. We derive our QoE model
PL = ∑[ || ( ) ( )− ( ) ( ( ))|| ] (13) from [67]. Using subjective Mean Opinion Score (MOS)
1
=1 i measurements, they derive QoE as a second degree func‑
where, is the weight for perceptual loss and ( ) is the tion of the image PSNR and Frame Rate (FR), itted to the
ith layer of VGG19 network with elements of VGG layer. MOS:
© International Telecommunication Union, 2021 37