
Page 57 - ITU Journal Future and evolving technologies Volume 2 (2021), Issue 4 – AI and machine learning solutions in 5G and future networks
P. 57
ITU Journal on Future and Evolving Technologies, Volume 2 (2021), Issue 4
Eye blinks: The average human blink rate of 0.28
blinks/second, especially when considering that the blink
rate increases to 0.4blinks/second during conversation.
Fig. 19 shows the sharp decline in the eye aspect
ratio [75] at the centre which justi ies the generation
of blinks in the predicted videos. Table 1 shows the
blinks/sec of 0.45 on the GRID data set.
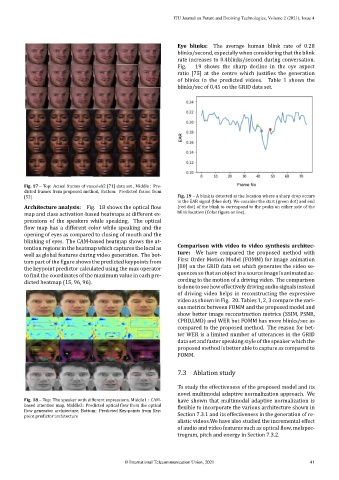
Fig. 17 – Top: Actual frames of voxceleb2 [71] data set , Middle : Pre‑
dicted frames from proposed method, Bottom: Predicted frame from
[52] Fig. 19 – A blink is detected at the location where a sharp drop occurs
in the EAR signal (blue dot). We consider the start (green dot) and end
Architecture analysis: Fig. 18 shows the optical low (red dot) of the blink to correspond to the peaks on either side of the
map and class activation‑based heatmaps at different ex‑ blink location (Color igure online).
pressions of the speakers while speaking. The optical
low map has a different color while speaking and the
opening of eyes as compared to closing of mouth and the
blinking of eyes. The CAM‑based heatmap shows the at‑
tention regions in the heatmap which captures the local as Comparison with video to video synthesis architec‑
well as global features during video generation. The bot‑ ture: We have compared the proposed method with
tom part of the igure shows the predicted keypoints from First Order Motion Model (FOMM) for image animation
the keypoint predictor calculated using the max operator [80] on the GRID data set which generates the video se‑
to ind the coordinates of the maximum value in each pre‑ quencessothatanobjectinasourceimageisanimatedac‑
dicted heatmap (15, 96, 96). cording to the motion of a driving video. The comparison
is done to seehow effectivelydrivingaudio signals instead
of driving video helps in reconstructing the expressive
video as shown in Fig. 20. Tables 1, 2, 3 compare the vari‑
ous metrics between FOMM and the proposed model and
show better image reconstruction metrics (SSIM, PSNR,
CPBD,LMD) and WER but FOMM has more blinks/sec as
compared to the proposed method. The reason for bet‑
ter WER is a limited number of utterances in the GRID
data set and faster speaking style of the speaker which the
proposed method is better able to capture as compared to
FOMM.
7.3 Ablation study
To study the effectiveness of the proposed model and its
novel multimodal adaptive normalization approach. We
Fig. 18 – Top: The speaker with different expressions, Middle1 : CAM‑ have shown that multimodal adaptive normalization is
based attention map, Middle2: Predicted optical low from the optical lexible to incorporate the various architecture shown in
low generator architecture, Bottom: Predicted Key‑points from Key‑
point predictor architecture Section 7.3.1 and its effectiveness in the generation of re‑
alistic videos.We have also studied the incremental effect
of audio and video features such as optical low, melspec‑
trogram, pitch and energy in Section 7.3.2.
© International Telecommunication Union, 2021 41