
Page 58 - ITU Journal Future and evolving technologies Volume 2 (2021), Issue 4 – AI and machine learning solutions in 5G and future networks
P. 58
ITU Journal on Future and Evolving Technologies, Volume 2 (2021), Issue 4
Table 7 – Incremental study of multimodal adaptive normalization on
GRID data set
Method SSIM↑ PSNR↑ CPBD↑ blinks/sec WER↓
Base Model(BM) 0.776 27.99 0.213 0.02 57.9
BM + OFP+mel 0.878 28.43 0.244 0.38 27.4
BM + OFP+mel+pitch 0.881 28.57 0.264 0.41 24.1
BM+OFP+mel+pitch+energy 0.908 29.78 0.272 0.45 23.7
8. PSYCHOPHYSICAL ASSESSMENT
Results are visually rated (on a scale of 5) individually
by 25 persons, on three aspects, lip synchronization, eye
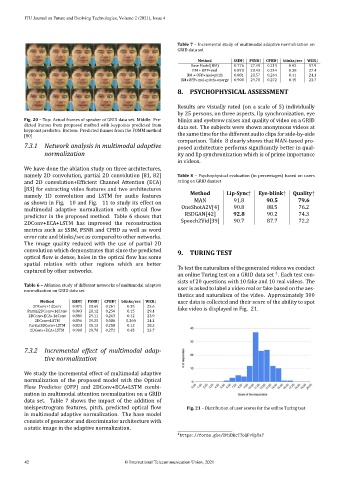
Fig. 20 – Top: Actual frames of speaker of GRID data set. Middle: Pre‑ blinks and eyebrow raises and quality of video on a GRID
dicted frames from proposed method with keypoints predicted from data set. The subjects were shown anonymous videos at
keypoint predictor. Bottom: Predicted frames from the FOMM method
[80] the same time for the different audio clips for side‑by‑side
comparison. Table 8 clearly shows that MAN‑based pro‑
7.3.1 Network analysis in multimodal adaptive posed architecture performs signi icantly better in qual‑
normalization ity and lip synchronization which is of prime importance
in videos.
We have done the ablation study on three architectures,
namely 2D convolution, partial 2D convolution [81, 82] Table 8 – Psychophysical evaluation (in percentages) based on users
and 2D convolution+Ef icient Channel Attention (ECA) rating on GRID daatset
[83] for extracting video features and two architectures
namely 1D convolution and LSTM for audio features Method Lip‑Sync↑ Eye‑blink↑ Quality↑
as shown in Fig. 10 and Fig. 11 to study its effect on MAN 91.8 90.5 79.6
multimodal adaptive normalization with optical low OneShotA2V[4] 90.8 88.5 76.2
RSDGAN[42] 92.8 90.2 74.3
predictor in the proposed method. Table 6 shows that
Speech2Vid[39] 90.7 87.7 72.2
2DConv+ECA+LSTM has improved the reconstruction
metrics such as SSIM, PSNR and CPBD as well as word
error rate and blinks/sec as compared to other networks.
The image quality reduced with the use of partial 2D
convolution which demonstrates that since the predicted 9. TURING TEST
optical low is dense, holes in the optical low has some
spatial relation with other regions which are better
captured by other networks. To test the naturalism of the generated videos we conduct
4
an online Turing test on a GRID data set . Each test con‑
sists of 20 questions with 10 fake and 10 real videos. The
Table 6 – Ablation study of different networks of multimodal adaptive
normalization on GRID data set user is asked to label a video real or fake based on the aes‑
thetics and naturalism of the video. Approximately 300
Method SSIM↑ PSNR↑ CPBD↑ blinks/sec WER↓ user data is collected and their score of the ability to spot
2DConv+1dConv 0.875 28.65 0.261 0.35 25.6
Partial2DConv+1dConv 0.803 28.12 0.256 0.15 29.4 fake video is displayed in Fig. 21.
2DConv+ECA+1dConv 0.880 29.11 0.263 0.42 23.9
2DConv+LSTM 0.896 29.25 0.086 0.260 24.1
Partial2DConv+LSTM 0.823 28.12 0.258 0.12 28.3
2DConv+ECA+LSTM 0.908 29.78 0.272 0.45 23.7
7.3.2 Incremental effect of multimodal adap‑
tive normalization
We study the incremental effect of multimodal adaptive
normalization of the proposed model with the Optical
Flow Predictor (OFP) and 2DConv+ECA+LSTM combi‑
nation in multimodal attention normalization on a GRID
data set. Table 7 shows the impact of the addition of
melspectrogram features, pitch, predicted optical low Fig. 21 – Distribution of user scores for the online Turing test
in multimodal adaptive normalization. The base model
consists of generator and discriminator architecture with
a static image in the adaptive normalization.
4 https://forms.gle/DM1DRcTToQFvUpTa7
42 © International Telecommunication Union, 2021