
Page 55 - ITU Journal Future and evolving technologies Volume 2 (2021), Issue 4 – AI and machine learning solutions in 5G and future networks
P. 55
ITU Journal on Future and Evolving Technologies, Volume 2 (2021), Issue 4
1. PSNR‑ Peak Signal to Noise Ratio: It computes the
peak signal to noise ratio between two images. The higher
the PSNR the better the quality of the reconstructed im‑
age.
2. SSIM‑ Structural Similarity Index: It is a percep‑
tual metric that quanti ies image quality degradation. The
larger the value the better the quality of the reconstructed
image.
3. CPBD‑ Cumulative Probability Blur Detection: It
is a perceptual based no‑reference objective image sharp‑
ness metric based on the cumulative probability of blur
detection developed at the image.
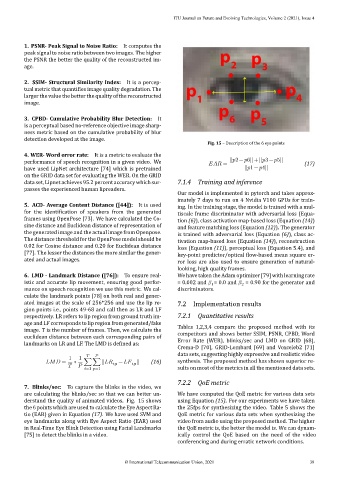
Fig. 15 – Description of the 6 eye points
4. WER‑ Word error rate: It is a metric to evaluate the
performance of speech recognition in a given video. We = || 2− 6||+|| 3− 5|| (17)
have used LipNet architecture [74] which is pretrained || 1− 4||
on the GRID data set for evaluating the WER. On the GRID
data set, Lipnet achieves 95.2 percent accuracy which sur‑ 7.1.4 Training and inference
passes the experienced human lipreaders.
Our model is implemented in pytorch and takes approx‑
imately 7 days to run on 4 Nvidia V100 GPUs for train‑
5. ACD‑ Average Content Distance ([44]): It is used ing. In the training stage, the model is trained with a mul‑
for the identi ication of speakers from the generated tiscale frame discriminator with adversarial loss (Equa‑
frames using OpenPose [73]. We have calculated the Co‑ tion (6)), class activation map‑based loss (Equation (14))
sine distance and Euclidean distance of representation of
and feature matching loss (Equation (12)). The generator
the generated image and the actual image from Openpose.
is trained with adversarial loss (Equation (6)), class ac‑
The distance threshold for the OpenPose model should be
tivation map‑based loss (Equation (14)), reconstruction
0.02 for Cosine distance and 0.20 for Euclidean distance
loss (Equation (11)), perceptual loss (Equation 5.4), and
[77]. The lesser the distances the more similar the gener‑
key‑point predictor/optical low‑based mean square er‑
ated and actual images.
ror loss are also used to ensure generation of natural‑
looking, high quality frames.
6. LMD ‑ Landmark Distance ([76]): To ensure real‑ We have taken the Adam optimizer [79] with learning rate
istic and accurate lip movement, ensuring good perfor‑ = 0.002 and = 0.0 and = 0.90 for the generator and
2
1
mance on speech recognition we use this metric. We cal‑ discriminators.
culate the landmark points [78] on both real and gener‑
ated images at the scale of 256*256 and use the lip re‑ 7.2 Implementation results
gion points i.e., points 49‑68 and call then as LR and LF
respectively. LR refers to lip region from ground truth im‑ 7.2.1 Quantitative results
age and LF corresponds to lip region from generated/fake
Tables 1,2,3,4 compare the proposed method with its
image. T is the number of frames. Then, we calculate the
competitors and shows better SSIM, PSNR, CPBD, Word
euclidean distance between each corresponding pairs of
Error Rate (WER), blinks/sec and LMD on GRID [68],
landmarks on LR and LF. The LMD is de ined as:
Crema‑D [70], GRID‑Lombard [69] and Voxceleb2 [71]
1 1 data sets, suggesting highly expressive and realistic video
= ∗ ∑∑|| − || (16) synthesis. The proposed method has shown superior re‑
t,p t,p
=1 =1 sults on most of the metrics in all the mentioned data sets.
7.2.2 QoE metric
7. Blinks/sec: To capture the blinks in the video, we
are calculating the blinks/sec so that we can better un‑ We have computed the QoE metric for various data sets
derstand the quality of animated videos. Fig. 15 shows using Equation (15). For our experiments we have taken
the 6 points which are used to calculate the Eye Aspect Ra‑ the 25fps for synthesizing the video. Table 5 shows the
tio (EAR) given in Equation (17). We have used SVM and QoE metric for various data sets when synthesizing the
eye landmarks along with Eye Aspect Ratio (EAR) used video from audio using the proposed method. The higher
in Real‑Time Eye Blink Detection using Facial Landmarks the QoE metric is, the better the model is. We can dynam‑
[75] to detect the blinks in a video. ically control the QoE based on the need of the video
conferencing and during erratic network conditions.
© International Telecommunication Union, 2021 39