Monitoring of nitrogen dioxide levels over Northern Italy |
|
The Po Valley in Northern Italy is known for its high levels of air pollution, which makes the continual monitoring and analysis of various air pollutant concentrations imperative. The Valley is situated by the mountains, far from the ocean and its cleansing sea breezes – which places it at a natural disadvantage in combatting the effects of pollutants and emissions released due to industry and other human activity.[1]
Recent monitoring efforts by the Copernicus Sentinel-5P satellite mission between January and April 2019 show particularly high levels of nitrogen dioxide (NO2) in the Valley region, as illustrated in the following Figure. These measurements gathered are then analysed by scientists. The Po Valley's observed data has shown that the nitrogen dioxide levels exhibit a strong correlation with traffic patterns, with daily peaks occurring during the morning and evening weekday rush hours, and lower concentrations observed over the weekends.[2]
Nitrogen dioxide has significant negative impacts on human health, particularly causing and exacerbating respiratory problems. Therefore, observation, monitoring and analysis are crucial for informing local and regional policy to counteract these harmful air pollutant levels. As a result of the data and information gleaned from such monitoring efforts, the region has set a goal of coming in at, or under, the European Union (EU) 35-day limit of major air pollutants by 2025. The number of citizens using public transport, car sharing and cycling has also increased due to the resulting education and awareness efforts.[3]
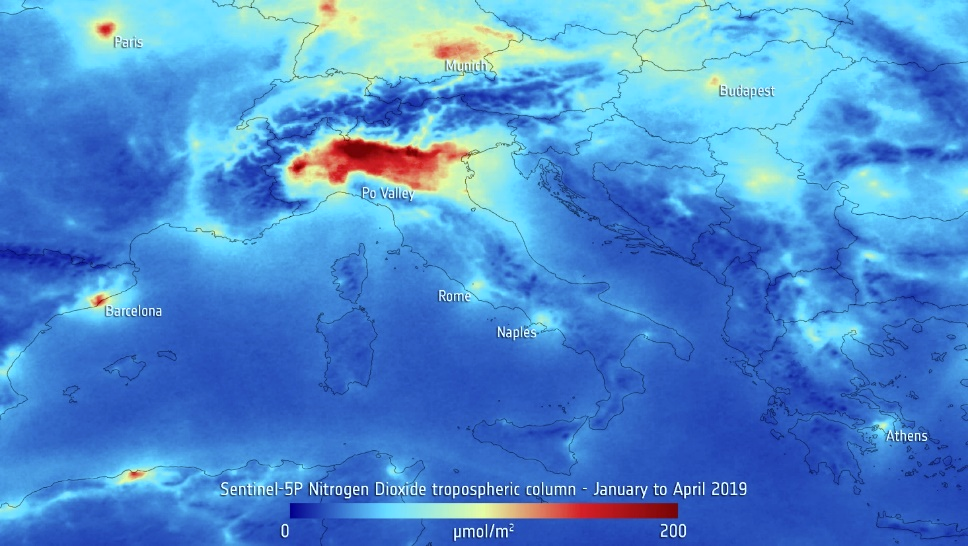 Nitrogen dioxide over northern Italy based on measurements gathered by Copernicus Sentinel-5P Nitrogen dioxide over northern Italy based on measurements gathered by Copernicus Sentinel-5P
[1] Cornu, Céline. 'Italy's Polluted Po Valley Gasps for Fresh Air.' Phys.org, Science X Network, 28 Feb. 2019, phys.org/news/2019-02-italy-polluted-po-valley-gasps.html.
[2] European Space Agency (ESA). 'Nitrogen Dioxide over Northern Italy.' European Space Agency, 16 May 2019, www.esa.int/spaceinimages/Images/2019/05/Nitrogen_dioxide_over_northern_Italy.
[3] Bigi, Alessandro, et al. 'Analysis of the Air Pollution Climate at a Background Site in the Po Valley.' Journal of Environmental Monitoring: JEM, U.S. National Library of Medicine, Feb. 2012, www.ncbi.nlm.nih.gov/pubmed/22170095. |
Monitoring crop growth in Belgium[4] |
|
The Copernicus Sentinel-2 satellite mission is designed to provide images that can be used to 'distinguish between different crop types, as well as data on numerous plant features, such as leaf area, chlorophyll content and water content – all essential for accurately monitoring plant growth'. In particular, these data are used to measure the 'leaf area index' (LAI)
[5] of vegetation. This can, in turn, be applied to 'increase yields by identifying when certain crops should be harvested according to satellite observations, trigger automated pest control by vector mapping, and even optimize irrigation based on weather data and crop monitoring'. The first Figure below is part of an animation that shows the development of crop fields in Belgium between March and October 2016. The area pictured has rich but varying agriculture, with crops including barley, corn, potatoes, sugar beet, wheat, and assorted fruits and vegetables. All these crops have varying planting and harvest times and annual yields.[6] The full animation would show clear changes in the fields as different crops grow at different rates and are harvested in different seasons. This kind of information is now being utilized to support the updating of the EU's Common Agricultural Policy. The Figure following that shows agricultural data being used on the field though further mobile ICTs. |

Monitoring of crop growth in Belgium based on data gathered by Copernicus Sentinel-2 |
 Use of satellite data in precision agriculture |
[4] European Space Agency (ESA). ‘Precision Agriculture.’ European Space Agency, 17 Dec. 2018, www.esa.int/spaceinimages/Images/2018/12/Precision_agriculture.
[5] Leaf area index is a dimensionless quantity that characterizes plant canopies. It is defined as the one-sided green leaf area per unit ground surface area in broadleaf canopies.
[6] Encyclopedia of the Nations. 'Belgium - Agriculture.' Encyclopedia of the Nations, www.nationsencyclopedia.com/economies/Europe/Belgium-AGRICULTURE.html. |
Monitoring the loss of the Amazon rainforest in Bolivia[7] |
|
The monitoring efforts provided by missions such as the Sentinel-2A are vital to charting the course of the Amazon's deforestation, and in providing support to environmental legislative and international advocacy interventions aimed at curbing the rapid loss of the tropical forest ecosystem and the continuing encroachment of agricultural and urban areas. The Figure below shows a Copernicus Sentinel-2A satellite image (captured on 30 September 2017) of an area in Bolivia next to the east of the city of Santa Cruz (seen on the mid-left) that was once covered by tropical forest trees but has now been cleared for resettlement schemes and features a huge patchwork of agricultural fields. Santa Cruz, situated on the Pirai River in the tropical lowlands of eastern Bolivia, is one of the fastest- growing cities in the world and is an important commercial centre for the region. Back in the 1960s, the area to the east of the city, particularly to the east of the (also visible) Rio Grande, was largely inaccessible due to the thick Amazon forest. However, as it is relatively flat lowland with abundant rainfall, it was repurposed for farming as part of a drive to develop and improve the economy. This drive has resulted in rapid deforestation since the 1980s, partly in order to accommodate programmes to resettle people from the Andean high plains and to develop the area for soybean production. Satellite monitoring shows that this has resulted in the region being transformed from dense forest into a still growing mosaic of rectangular fields and hubs of communal farming land. While urbanization is important for the economic health and future growth of regions, it must be undertaken in a thoughtful manner when natural resources as scarce as rainforests are impacted. Special care must be taken to avoid useless or uncontrolled deforestation.

Monitoring of deforestation of the Amazon next to Santa Cruz, Bolivia based on data gathered by Copernicus Sentinel-2A
[7] European Space Agency (ESA). 'Giving up Forests.' European Space Agency, 21 Mar. 2018, www.esa.int/spaceinimages/Images/2018/03/Giving_up_forests. |
The Edge, the smartest and greenest building on earth – the case of Amsterdam |
|
The Edge is an office building located in Amsterdam that is well-known for its exceptional sustainability and environmental performance. Based on the Building Research Establishment Environmental Assessment Method (BREEAM), one of the world's most renowned methods for assessing and certifying the sustainability of buildings has given the Edge one of the highest-ever sustainability scores: 98.4 per cent.[8] Located in the Zuidas business district in Amsterdam, the Edge is fitted with more than 30 000 sensors that monitor energy use and temperature, a smart lighting system that tracks lighting levels, and it has over 65 000 square feet (6 039m2) of solar panels. The Edge boasts that it uses 70 per cent less electricity than other comparable office buildings. It is not only energy neutral, but it is energy positive, meaning that the amount of energy generated through renewables is higher than the energy that it consumes. According to BREEAM, the Edge has the following key environmental features: - Smart lighting – The building's LED lighting system and its more than 30 000 sensors that continuously monitor occupancy, movement, lighting level, and humidity and temperature. Energy use is simultaneously adjusted accordingly.
- Solar panel roof – the 65 000 square feet (6 039 m2) of solar panels located on the roof and facades and the nearby university are powering the Edge, allowing it to produce more energy than it consumes.
- Energy Reuse – The 15-storey atrium acts as a buffer between the interior office and the exterior. Fitted with sound barriers and more than 7 metres of window, the atrium takes in excess ventilation air from the office space and uses it again to power its air conditioning. Any excessive energy is then passed through a heat exchanger on the top of the atrium where it will be redistributed for other uses.
- Rain water reuse – rain water is collected on the rooftop and used to flush toilets and irrigate the green terraces.
In addition, to further optimize energy usage and resource allocation, a mobile application is developed for all employees of the building. The application helps them find parking spaces using image recognition technologies; it also helps them to find empty desks and conference rooms, to adjust temperature and lighting levels around them, to locate their colleagues, to select ingredients for their meals and much more.[9][10][11]

The Edge in daytime (Source: Bloomberg)
[8] BREEAM. 'The Edge, Amsterdam.' Building Research Establishment Ltd, 3 Apr. 2018, www.breeam.com/case-studies/offices/the-edge-amsterdam/.
[9] Randall, Tom. 'The Smartest Building in the World.' Bloomberg Businessweek, Bloomberg, 23 Sept. 2015, www.bloomberg.com/features/2015-the-edge-the-worlds-greenest-building/.
[10] Hutt, Rosamond. 'Is This the World's Greenest, Smartest Office Building?' World Economic Forum (WEF), 28 Mar. 2017, www.weforum.org/agenda/2017/03/smart-building-amsterdam-the-edge-sustainability/.
[11] van Hooijdonk, Richard. 'The Smartest, Greenest Office Building on Earth – The Edge – Is like a Computer with a Roof.' Richard Van Hooijdonk Blog, 26 June 2018, www.richardvanhooijdonk.com/en/blog/smartest-greenest-building-earth-edge-like-computer-roof/. |
Using ICTs to turn old buildings into smart buildings – the case of Finland [12] |
In an effort to reduce the energy consumption of existing buildings, six housing companies in Finland have partnered with the sustainable urban development of Finland to install IoT sensors in the country's older buildings. These IoT sensors collect and analyse information on the building's energy use, particularly its heating, lighting and cooling systems. The companies will then find the most cost-effective ways of reducing their overall energy consumption. Collecting energy data via the IoT has the added benefits of being 10 times less expensive and time consuming than taking measurements by knocking door to door. It is worth noting that retrofitting existing buildings to become more energy efficient is necessary to reduce the overall energy consumption of a given city. The carbon emissions of older buildings must be reduced in parallel with the development of smart buildings.
 An IoT sensor on one of the buildings An IoT sensor on one of the buildings
[12] Smart Cities World. 'Helsinki and Vantaa Make Old Buildings Smart.' 6 June 2019, www.smartcitiesworld.net/news/news/helsinki-and-vantaa-make-old-buildings-smart-4250. |
Project Natick – An underwater data centre powered by renewable energy |
|
Project Natick is a pioneer project headed by Microsoft to investigate the possibility of manufacturing and operating environmentally sustainable, prepackaged data centre units that can be ordered to size, rapidly deployed and left to operate with lights out on the seabed for years. The researchers recognized that the demand for data centre resources and the volume of cloud data are growing exponentially as corporations increasingly shift their network and computing needs to the cloud.

The researchers of Project Natick One of the reasons that the researchers were exploring the possibility of deploying a data centre underwater was because more than half the world's population lives within about 120 miles of the coast. Being able to rapidly deploy a data centre in bodies of water close to the coastal cities allows data to travel only for a short distance before reaching its destination, which leads to faster and smoother data services, and less energy use.[13] High-speed data transfer is particularly critical to the delivery of AI programmes and other data-driven technologies. Emergency services and disaster management systems that depend on the availability of real-time data cannot afford to have data that are delayed. The data centre is 40-feet (12.2 metres) long, loaded with 12 racks containing a total of 864 servers and the associated cooling system infrastructure. With technical expertise in military-grade water vessels and submarines from the Navel Group, the researchers were able to deploy the underwater data centre in Scotland, near the Orkney Islands. Most impressively, this submarine-like data centre is powered by renewable energy. The onshore wind turbines and solar panels generate more than enough electricity to power the entire Orkney Islands. A simple cable from the islands can send sufficient electricity to power the data centre, taking one step closer to achieving an energy-self-sufficient data centre with no emissions.
 The submarine-like data centre from Project Currently, the project is determining the economic viability of operating such data centres. The development of this project could significantly change the landscape of cloud computing and the data footprint.
[13] Roach, John. 'Under the Sea, Microsoft Tests a Datacenter That's Quick to Deploy, Could Provide Internet Connectivity for Years.' Microsoft, 5 June 2018, news.microsoft.com/features/under-the-sea-microsoft-tests-a-datacenter-thats-quick-to-deploy-could-provide-internet-connectivity-for-years/. |
Using ICTs to manage traffic flows – the case of Moscow [14] |
Moscow has undergone a major revitalization of its urban infrastructure to enhance its adaptation and mitigation efforts. Under the leadership of the Moscow City Government and its Smart City Lab, the city's IT department has greatly enhanced the city's ICT capability. Moscow has added more than 18 800 public Wi-Fi hotspots in order to enhance the connectivity of its citizens. Wireless providers have also installed more than 1 000 4G base stations around the city to ensure that high-speed services can reach every part of the city. This has laid the foundation for mitigation measures that involve the use of ICTs. In an effort to reduce traffic volume and the number of cars on the road, Moscow has undertaken a series of ICT-related measures to encourage the use of public transit and reduce demand for car use. Moscow's intelligent traffic control system comprises more than 2 000 traffic lights, 3 500 traffic detectors and 2 000 CCTV cameras. These devices are able to collect and share data in real time in the city's Traffic Management Centre's situation room where they can be analysed thus allowing informed decisions on relieving traffic to be made. Drivers in Moscow are now spending less time idling at traffic lights or driving around to find a parking spot thanks to the intelligent traffic system, and this has contributed to the reduction of carbon emissions in the city.
 A Troika bracelet, which can be used to pay for public transport tickets in Moscow Moscow also has also introduced other measures to encourage the use of public transit, including the introduction of parking fees and reducing free parking spots in the city. At the same time, the city has implemented online maps and online payment for parking in order to improve efficiency. The city government has also invested in updating its public transit and payment methods. Most noticeably, the Troika transport card was introduced in 2013; this is an electronic device that allows seamless transfer between surface transport modes.
 Moscow Traffic Management Centre Situation Room As a result, almost 100 per cent of the major road infrastructure is being monitored electronically by in-road sensors or cameras, or the combination of the two. Precisely 51.41 per cent of Moscow's signal-controlled road intersections use adaptive traffic control or prioritization measures that allow the traffic signals to respond to on-going traffic patterns. Adaptive traffic control and prioritization measurements include embedded road sensors that change traffic signals based on actual vehicle flow and other comparable sensors that provide similar functions. This can lead to less idling time for cars at intersections and better traffic flow.
[14] Smiciklas, John, and Sahifa Imran. 'Implementing ITU-T International Standards to Shape Smart Sustainable Cities: The Case of Moscow.' International Telecommunication Union (ITU), Nov. 2018, https://www.itu.int/en/publications/Documents/tsb/2018-U4SSC-Case-of-Moscow/mobile/index.html#p=3. |
The Belfast Rapid Transit System – the Glider |
|
Belfast has consistently been one of the most congested cities in the United Kingdom (UK). Belfast has the second-highest amount of time lost per driver in the UK, averaging 190 hours per driver.[15] The idling time spent in traffic congestion not only represents an economic loss for the drivers but also entails substantial vehicle emissions.

The smart card that can pay for the tickets for the Gliders In 2016, the Belfast Rapid Transit project Glider (BRT-Glider) was proposed; this would see the deployment of a diesel-electric hybrid buses to connect the east and west sides of the City, along with major residential areas, intersections and key locations of economic and social activity within the city. The goals of this project are to provide people with better access to city services, reduce public transport journey times and improve the reliability of public transport, while reducing the number of cars that are on the road, relieving traffic congestion at peak hours and subsequently reducing emissions from transportation.[16]
 Images of BRT-Glider vehicles The BRT-Glider vehicles provide passengers with real-time information, including audio and visual text on destination announcements, free on-board Wi-Fi and USB chargers. Passengers can use an application developed by the operator to plan their trip in advance and to obtain other information. The Glider is also connected to the rest of the public transit system in Belfast, allowing passengers to switch swiftly from one mode of public transport to another. A smart card, called Smartlink, can also be used to pay for the tickets of the Glider's vehicles. The BRT-Glider project, which was partly funded by the European Regional Development Fund through the Investment for Growth and Jobs Programme, has entered full operation in September 2018.
[15] Edwards, Mark. 'Belfast Drivers Spent 190 Hours Stuck in Traffic Last Year - Second Worst in UK.' Belfast Telegraph, 12 Feb. 2019, www.belfasttelegraph.co.uk/news/northern-ireland/belfast-drivers-spent-190-hours-stuck-in-traffic-last-year-second-worst-in-uk-37808917.html.
[16] Department of Infrastructure, Belfast. 'Belfast Rapid Transit - Glider - Introduction.' www.infrastructure-ni.gov.uk/articles/belfast-rapid-transit-glider-introduction. |
Enhancing early warning systems at the local level – the case of Peru |
|
Peru, a country with a highly-variable climate and extreme weather, has been particularly hard hit by disaster in the last few years, resulting in more efforts for better preparedness, including the construction of early warning systems (EWS).

Steps of the Early Warning System One example is the EWS deployed in the city of Chosica, which is very prone to floods and mudslides. This EWS analyses photos and data from sensors and cameras installed on houses to track rainfall data and soil saturation levels. The camera, placed on rooftops, takes photos every two to five minutes, which are then sent to the government's local data monitoring centre. As a result, the authority and residents of Chosica are able to react to potential flooding by developing disaster-response measures that, through the use of their EWS,[17] could ultimately prevent the loss of property and life, as well as other damage.

Cameras installed on a rooftop to capture pictures and collect data for the EWS in Chosica The EWS can add precious minutes in the event of landslides and flooding – with the municipality receiving updates from the EWS it can immediately notify community leaders, via text message, who can then alert their community in order to get the evacuation process underway.[18]
[17] Aréstegui, Miguel. 'Intermediate Climate Information Systems for Early Warning Systems.' Practical Action, June 2018.
[18] The International Red Cross and Red Crescent Movement. 'Early Warning Can Transform Lives.' 17 Oct. 2018, media.ifrc.org/ifrc/2018/10/17/early-warning-can-transform-lives/. |
Enhancing early warning system – the case of the Philippines |
|
The Philippines is highly vulnerable to the impacts of climate change, including sea level rise, increased frequency of extreme weather events, rising temperatures and extreme rainfall. Indeed, the country is at risk from a high exposure to natural hazards (cyclones, landslides, floods, and droughts), a dependence on climate-sensitive natural resources and vast coastlines where all major cities and the majority of the population reside. The country has a history of using innovative approaches and technologically-driven systems, including early-warning systems, to adapt to the impacts of climate change. The country is continuously enhancing its early-warning system by using knowledge, technological innovation and education to build a culture of safety and resilience at all levels through multi-hazard mapping and disaster-risk assessment. It is now able to reduce its disaster risks by actively identifying, assessing and monitoring various risks at the local and national levels and is now capable of planning and executing flood mitigation strategies to the communities living along 18 major river systems through their early warning system. The interactive map below, as developed by the Philippine Atmospheric Geophysical and Astronomical Services Administration (PAGASA), provides users with the possibility of checking on warnings and map hazards for flooding, storm surges and landslides.[19]
 Live information feed and warning map. Source: http://bagong.pagasa.dost.gov.ph/
[19] Malano, Vicente. 'Philippine Early Warning System.' Philippine Atmospheric, Geophysical and Astronomical Services Administration, 16 Mar. 2015, www.wmo.int/pages/prog/drr/events/WCDRR-MHEWS/documents/VicenteMalano.pdf. |
Malawi's modern lightning detecting system saves lives and livelihoods |
|
Vulnerability to climate change impacts is high in Malawi, which is affected not only by floods and droughts but also by lightning. Indeed, Malawi's annual death rate from lightning 'is extremely high compared to other countries in the world' and 16 times higher than similar sub-regions in South Africa.
In direct response to this challenge, a project funded by the Green Climate Fund, 'Scaling up the Use of Modernized Climate Information and Early Warning Systems' (M-CLIMES), is working to improve early- warning weather and climate information systems in order to protect vulnerable communities. This includes the installation of eight lightning detection sensors across the country. These can calculate the direction and severity of lightning – indicating storm strength and able to precisely locate lighting during a thunderstorm – and warn rural communities. By raising awareness within affected communities, the capacity of local communities, district councils, and national agencies to respond to emergencies will be strengthened through training and improved emergency services. Through these efforts, it is anticipated that 2.1 million people will benefit from increased resilience to lightning and the associated risks.[20] |
 Deployment of a lightning detection sensor Deployment of a lightning detection sensor |  Visual of lightning intensity in Malawi Visual of lightning intensity in Malawi |
[20] The International Red Cross and Red Crescent Movement. 'Early Warning Can Transform Lives.' 17 Oct. 2018, media.ifrc.org/ifrc/2018/10/17/early-warning-can-transform-lives/. |
Using drones, sensors and machine learning to combat wildfires in California and Mozambique |
|
In California, wildfires are expected to worsen due to its atmospheric conditions being affected by climate change. The increase in the frequency and intensity of wildfires in California is consistent with the historical trends of increasing temperatures and dryness in the atmosphere. Higher temperatures and less rain are creating a drier landscape that gives fires the opportunity to burn longer and stronger. The 2018 wildfire season was the deadliest and most destructive on record in California. Firefighters are stretched beyond capacity and there is a need to focus on ways to improve response time and gather real-time information for better decision making. Unmanned Aircraft System (UAS, or drones) offer a bird's-eye view of disaster conditions. UAVs are becoming an invaluable tool for firefighters to safely identify threats and reduce exposure to dangerous conditions. Some UAVs are equipped with Light Detection and Ranging (LIDAR) technology,[21] which uses pulsed light to measure distances and generate precise 3D fuel maps that show where fires are most likely to spread.
 Drones can also register wind direction and intensity, so helping firefighters to determine the appropriate course of action and issue the necessary warnings to vulnerable communities. Colorado is trialling a system that sends live drone footage straight to firefighters' phones. In an attempt to predict and prevent wildfires, new innovative solutions and algorithms are also being tested to identify and predict areas in a forest that are susceptible to wildfire, thereby providing an early warning for fire departments. Machine learning tools analysing the images of biomass can help estimate moisture content in order to determine the amount of dead fuel in a forest. This avoids the need for people to physically visit forest areas, and can help predict the likelihood of wildfire in a particular location of the forest precisely. Perfect estimation of biomass build-up could significantly impede the speed and ferocity with which these fires spread, so reducing the costs of fighting them and also protecting homes and lives.[22] In Los Angeles, the fire department has also been testing a programme called FireMap, which is a computer programme that is capable of collecting and analysing real-time information on wildfires, including information on flammable materials, weather conditions, topography and other variables. A predictive map will then be generated by the programme's servers in San Diego based on the collected information that would allow the fire department to predict where an active fire would spread next.[23] Drones have also been increasingly used in developing countries. In Mozambique, drones were deployed during tropical cyclone Desmond in early 2019, in order to track rising flood waters and help prepare evacuation plans for the people coming to rescue them. With the live images taken at close range, rescuers were able to respond much faster and make better decisions. This is an example of how new technology can save lives and help communities hit by disasters within shorter time spans.[24]

Detailed images of power lines, poles, trees and other potential fire hazards along the power grid produced by LIDAR
[21] YellowScan. 'How LiDAR Works. Discover the Basics of UAV LiDAR.' www.yellowscan-lidar.com/applications-and-users/how-lidar-works.
[22] Savvides, Lexy. 'California's Fires Face a New, High-Tech Foe: Drones.' Cnet, 27 Aug. 2018, 5:00 a.m., www.cnet.com/news/californias-fires-face-a-new-high-tech-foe-drones/.
[23] Del Real, Jose A. 'Can “Big Data" Help Fight Big Fires? Firefighters Are Betting on It.' The New York Times, 24 June 2019, www.nytimes.com/2019/06/24/us/wildfires-big-data-california.html.
[24] Rae, Tej. 'Drones to the Rescue as Cyclone Desmond Storms Mozambique.' Medium, World Food Programme Insight, 24 Jan. 2019, insight.wfp.org/drones-to-the-rescue-as-cyclone-desmond-storms-mozambique-d7f501e40b0f. |
Using mobile phones to deliver weather and climate information – the case of Mali |
|
Mali's economy is primarily based on agriculture and agro-pastoralism, which is particularly weather dependent. Inconsistent rains and rising temperatures could be disastrous for smallholder farmer seeking to maintain yields and harvest products beyond subsistence farming. Extreme weather events – notably drought and flooding – can wipe out entire crops and disrupt planting cycles.[25] Adapting to a changing climate is becoming a must for many farmers, as the crops they manage are their livelihoods. A special project (RIC4REC) to help farming communities in Mali aims to build up the climate resiliency of 264 000 people in Mail by increasing access to, and the use of, climate information via mobile phones.[26] The use of mobile phone technology has improved the ability to anticipate and adapt to climate change based on the supply of information on future events in the short term (daily) and medium term (seasonal information), along with advice and recommendations on agricultural practices as per the specific needs of each producer. In the case of Mali, the Sènèkèla is a mobile application that focuses on empowering farmers. It delivers information on the latest farming techniques and marketplace statues to local farmers, allowing them to make better decisions. The Sandji, is a mobile application that focuses on delivering weather information to farmers. It enables farmers to make informed decisions on the best dates for ploughing, sowing, applying fertilizer for agricultural activities, and for other activities such as laundry and drying based on a given climate situation. The information provided can also be customised and tailored to the specific challenges faced by each farmer, or by other groups, because each application has a dedicated respondent to support the users of these applications, ensuring that the local farmers can take advantage of these services even if they are illiterate.[27] The project is already being developed further with a new set of activities. These activities will include the extension of climate-smart agricultural technologies and the effective use of agro-climatic information services by rural users. 
 Purposes of Sènèkèla and Sandji in providing climate information services
[25] Kadi, Mohammed. 'The State of Climate Information Services for Agriculture and Food Security in East African Countries.' Climate Change Agriculture and Food Security, The CGIAR Research Program on Climate Change, Agriculture and Food Security (CCAFS), 2011, ccafs.cgiar.org/sites/default/files/assets/docs/ccafs-wp-05-clim-info-eastafrica.pdf.
[26] The Strengthening Community Initiatives for Resilience to Climate Extremes (RIC4REC) project was developed by the UK Department for International Development (DfID) and funded the BRACED (Building Resilience and Adaptation to Climate Extremes and Disasters) program.
[27] Steenbergen, Margot. 'Mobile Phones Successfully Support Farmers with Weather and Climate Information – The Malian Experience by RIC4REC.' BRACED - Building Resilience and Adaption to Climate Extremes and Disasters, 16 Nov. 2017, www.braced.org/discussions/i/?id=03ce427e-eb29-4d9c-9d61-98c8c9bd7720. |
Using ICTs-enabled application for precise agriculture and climate-smart coffee production in Guatemala |
|
Guatemala has a high level of chronic malnutrition and has been listed in the top 10 most vulnerable countries in terms of climate change. Drought and shifting weather are affecting many small-scale farmers who find it difficult to feed their families.[28] The sector that has been hit the hardest is the coffee industry. Coffee plantations regularly suffer from rust plague, a disease that decreases coffee production. To address this challenge, the International Fund for Agricultural Development (IFAD) has partnered with Anacafé, the national coffee associate of Guatemala, to use ICTs to automate technical services, provide farmers with weather information, and give smallholders access to markets, financing and new technology. Drones, GPS sets, weather stations and data loggers are deployed to observe epidemiological conditions and analyse climatic data to generate a real-time alert system. New tools and weather stations have increased Anacafé's capacity to monitor agro-climatic conditions. They collect meteorological information every 15 minutes, enabling Anacafé to make better informed decisions. As a result, the risks faced during coffee production processes, such as crop plague and epidemiological challenges, have been reduced. Farmers have benefitted from having greater coffee production in response to their increased decision-making abilities, increased resilience to climate change, and the potential to extend these practices to other crops in the region that are part of their coffee production value chain.[29]

Local agricultural production The ICT measures implemented during the project have opened the way to new initiatives such as the Early Warning System for rust plague and new methodologies for monitoring plant diseases. In addition, the first survey of the Atlas of Coffee was carried out; this is an ICT tool that systematically collects maps and gathers them into an Atlas. It has reached 343 small coffee producers, from eight organized groups of producers in four coffee regions.[30]
[28] Steffens, Gena. 'Changing Climate Forces Desperate Guatemalans to Migrate." National Geographic, 23 Oct. 2018, www.nationalgeographic.com/environment/2018/10/drought-climate-change-force-guatemalans-migrate-to-us/.
[29] United States Agency for International Development (USAID). 'Economic Analysis of Feed the Future Investments Rural Value Chains Project – Anacafe.' Sept. 2013, www.usaid.gov/sites/default/files/documents/1865/Anacafe%20CBA%20Economic%20Analysis%20PUBLIC.pdf.
[30] Rural Solution Portal. 'Broadening the Usage of ICTs in the Coffee Value Chain.' ruralsolutionsportal.org/en/-/broadening-the-usage-of-icts-in-the-coffee-value-chain. |
Using ICTs for micro-level drought preparedness in India |
|
India, in particular its agricultural sector, is extremely vulnerable to drought due to the sector's dependency on rainfall and surface water. To face new challenges, the International Crops Research Institute for the Semi-Arid Tropics (ICRISAT) in India and its partners have experimented with various ICT tools such as video-conferencing, audio-conferencing, and mobile telephony for delivering agro-advisories related to weather and best agriculture practices. In particular, ICRISAT recognizes that a drought vulnerability map with timely weather information is equally crucial for planning micro-level climate adaptation strategies. These maps are colour-coded with red, orange, green and yellow coloured villages indicating their level of vulnerability to drought. With this, potentially vulnerable farmers have the means to assess their own vulnerability and make more informed decisions, so providing a sounder basis for designing adaptation strategies.

Drought Vulnerability Map and long-range prediction showing the status of surface water in meeting village requirements The maps were made available to rural communities during field surveys, and farming communities were sensitized about drought preparedness using ICT tools like mobile phones, video and audio conference systems. GIS Maps and ICT tools are also used to provide farmers with agro-advisory services and solve real-time field problems.[31]
[31] International Crops Research Institute for the Semi-Arid Tropics (ICRISAT). 'ICT-Enabled Knowledge Sharing in Support of Extension: Addressing the Agrarian Challenges of the Developing World Threatened by Climate Change, with a Case Study from India.' Open Access, 2007, oar.icrisat.org/2604/1/ICT-enabled_knowledge.pdf. |
Using mobile phone data to assess climate change and migration patterns in Bangladesh |
|
The coastal areas of Bangladesh are crowded and are exposed to frequent flooding from tropical cyclones, riverbank erosion, saline intrusion and rising sea levels. Cyclones Aila in 2009 and Mahasen in 2013 left at least 500 000 people temporarily landless and homeless, whilst up to a million people were displaced by riverbank erosion. To gain a better understanding of the migration and displacement patterns caused by Aila and Mahasen, researchers analysed the mobile phone data of 6 million people in southern Bangladesh, in order to identify the population movement in response to the cyclones. Their analysis revealed key information on minute-to-minute evacuation when the disasters struck and the long-term migration patterns. These data have provided important references to displaced communities and enabled them to prepare for future disaster responses.[32]

High-risk mobility of mobile phone users during cyclone landfall and passing (00:00–06:00, 16 May). The dark grey area indicates the most affected areas (REACH Initiative, 2013). The thickness of each link represents the number of moving SIM cards Rwanda's climate is temperate to subtropical, with two rainy seasons and two dry seasons each year. But due to climate change, Rwanda has been experiencing irregular lengthy rainfalls that wash out many roads and make them impassible. As a result, many infrastructures, communication networks and farms would be damaged or destroyed during the onset of extreme weather. This can cause decreasing yields in farms and means that people who need medical attention, such as a lifesaving transfusions, do not get the vital support that they need to survive. Medical service providers are also left powerless when the city's infrastructure is damaged beyond repair. This is known as “the last-mile problem", namely the inability to deliver needed medicine from a city to rural or remote locations due to the lack of adequate transportation, communication and supply chain infrastructure. Consequently, Rwanda has undertaken a series of ICT-centric measures aimed at minimizing these climate impacts. The 'Agricultural Service and Digital Inclusion in Rwanda' project has developed four mobile applications, including: 'Cure and feed your livestock', 'eNtrifood', 'Weather and crop calendar', and 'Agri Marketplace.'[33] These applications give farmers access to vital weather information, so allowing them to make better-informed decisions and adopt farming practices that can protect them from losses. Information on market status also allows farmers to decide which crop is in-demand and to set favourable prices depending on the market environment at any given time. This has been a tremendous success given that over 80 percent of the Rwandan population have mobile phones.
[32] 'Mobile Phone Data to Understand Climate Change and Migration Patterns in Bangladesh.' Flowminder, May 2016, web.flowminder.org/case-studies/mobile-phone-data-to-understand-climate-change-and-migration-patterns-in-bangladesh.[33] Ntirenganya, Emmanuel. 'How Technology Is Primed to Transform Farming in Rwanda.' The New Times | Rwanda, 9 Nov. 2017, www.newtimes.co.rw/section/read/223291. |