
Page 24 - Methodology to assess Net Zero progress in cities
P. 24
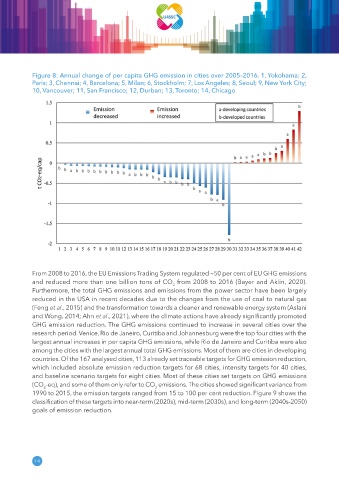
Figure 8: Annual change of per capita GHG emission in cities over 2005–2016� 1, Yokohama; 2,
            Paris; 3, Chennai; 4, Barcelona; 5, Milan; 6, Stockholm; 7, Los Angeles; 8, Seoul; 9, New York City;
            10, Vancouver; 11, San Francisco; 12, Durban; 13, Toronto; 14, Chicago


            From 2008 to 2016, the EU Emissions Trading System regulated ∼50 per cent of EU GHG emissions
            and reduced more than one billion tons of CO  from 2008 to 2016 (Bayer and Aklin, 2020).
                                                              2
            Furthermore, the total GHG emissions and emissions from the power sector have been largely
            reduced in the USA in recent decades due to the changes from the use of coal to natural gas
            (Feng et al., 2015) and the transformation towards a cleaner and renewable energy system (Aslani
            and Wong, 2014; Ahn et al., 2021), where the climate actions have already significantly promoted
            GHG emission reduction. The GHG emissions continued to increase in several cities over the
            research period. Venice, Rio de Janeiro, Curitiba and Johannesburg were the top four cities with the
            largest annual increases in per capita GHG emissions, while Rio de Janeiro and Curitiba were also
            among the cities with the largest annual total GHG emissions. Most of them are cities in developing
            countries. Of the 167 analysed cities, 113 already set traceable targets for GHG emission reduction,
            which included absolute emission reduction targets for 68 cities, intensity targets for 40 cities,
            and baseline scenario targets for eight cities. Most of these cities set targets on GHG emissions
            (CO -eq), and some of them only refer to CO  emissions. The cities showed significant variance from
                2                                      2
            1990 to 2015, the emission targets ranged from 15 to 100 per cent reduction. Figure 9 shows the
            classification of these targets into near-term (2020s), mid-term (2030s), and long-term (2040s-2050)
            goals of emission reduction.


             14