
Page 20 - Methodology to assess Net Zero progress in cities
P. 20
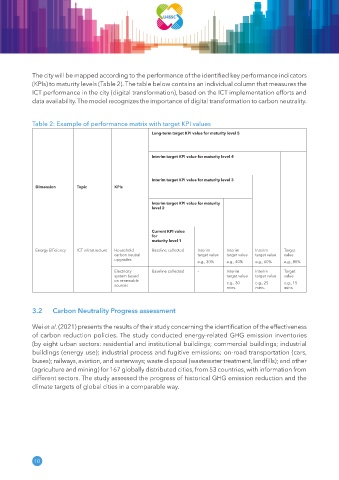
The city will be mapped according to the performance of the identified key performance indicators
            (KPIs) to maturity levels (Table 2). The table below contains an individual column that measures the
            ICT performance in the city (digital transformation), based on the ICT implementation efforts and
            data availability. The model recognizes the importance of digital transformation to carbon neutrality.


            Table 2: Example of performance matrix with target KPI values

                                                      Long-term target KPI value for maturity level 5


                                                      Interim target KPI value for maturity level 4


                                                      Interim target KPI value for maturity level 3
             Dimension      Topic        KPIs


                                                      Interim target KPI value for maturity
                                                      level 2


                                                      Current KPI value
                                                      for
                                                      maturity level 1
             Energy Efficiency  ICT infrastructure  Household   Baseline collected  Interim   Interim   Interim   Target
                                         carbon neutral               target value  target value  target value  value
                                         upgrades
                                                                      e.g., 30%  e.g., 40%  e.g., 60%  e.g., 80%
                                         Electricity   Baseline collected  –     Interim   Interim   Target
                                         system based                            target value  target value  value
                                         on renewable                            e.g., 30   e.g., 25   e.g., 15
                                         sources
                                                                                 mins.     mins.     mins.


            3.2     Carbon Neutrality Progress assessment


            Wei et al. (2021) presents the results of their study concerning the identification of the effectiveness
            of carbon reduction policies. The study conducted energy-related GHG emission inventories
            (by eight urban sectors: residential and institutional buildings; commercial buildings; industrial
            buildings (energy use); industrial process and fugitive emissions; on-road transportation (cars,
            buses); railways, aviation, and waterways; waste disposal (wastewater treatment, landfills); and other
            (agriculture and mining) for 167 globally distributed cities, from 53 countries, with information from
            different sectors. The study assessed the progress of historical GHG emission reduction and the
            climate targets of global cities in a comparable way.


             10