
Page 23 - Methodology to assess Net Zero progress in cities
P. 23
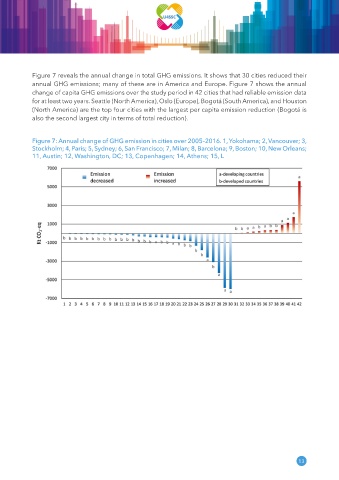
Figure 7 reveals the annual change in total GHG emissions. It shows that 30 cities reduced their
            annual GHG emissions; many of these are in America and Europe. Figure 7 shows the annual
            change of capita GHG emissions over the study period in 42 cities that had reliable emission data
            for at least two years. Seattle (North America), Oslo (Europe), Bogotá (South America), and Houston
            (North America) are the top four cities with the largest per capita emission reduction (Bogotá is
            also the second largest city in terms of total reduction).


            Figure 7: Annual change of GHG emission in cities over 2005–2016� 1, Yokohama; 2, Vancouver; 3,
            Stockholm; 4, Paris; 5, Sydney; 6, San Francisco; 7, Milan; 8, Barcelona; 9, Boston; 10, New Orleans;
            11, Austin; 12, Washington, DC; 13, Copenhagen; 14, Athens; 15, L


                                                                                                          13