
Page 21 - Methodology to assess Net Zero progress in cities
P. 21
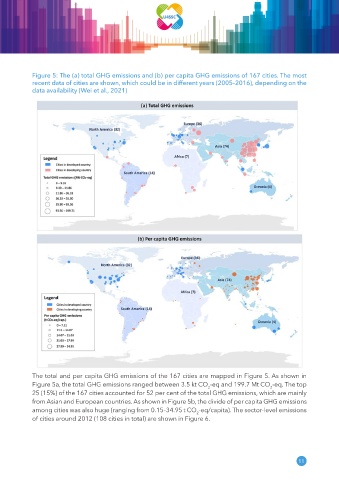
Figure 5: The (a) total GHG emissions and (b) per capita GHG emissions of 167 cities� The most
            recent data of cities are shown, which could be in different years (2005–2016), depending on the
            data availability (Wei et al�, 2021)


            The total and per capita GHG emissions of the 167 cities are mapped in Figure 5. As shown in
            Figure 5a, the total GHG emissions ranged between 3.5 kt CO -eq and 199.7 Mt CO -eq. The top
                                                                                                2
                                                                          2
            25 (15%) of the 167 cities accounted for 52 per cent of the total GHG emissions, which are mainly
            from Asian and European countries. As shown in Figure 5b, the divide of per capita GHG emissions
            among cities was also huge (ranging from 0.15–34.95 t CO -eq/capita). The sector-level emissions
                                                                      2
            of cities around 2012 (108 cities in total) are shown in Figure 6.


                                                                                                          11