Page 95 - Kaleidoscope Academic Conference Proceedings 2024
P. 95

Innovation and Digital Transformation for a Sustainable World


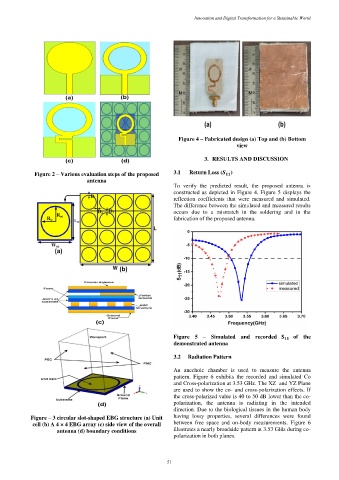
                                                                Figure 4 – Fabricated design (a) Top and (b) Bottom
                                                                                    view

                                                                         3. RESULTS AND DISCUSSION


             Figure 2 – Various evaluation steps of the proposed   3.1   Return Loss (   )
                                                                                    
                                antenna
                                                              To  verify  the  predicted  result,  the  proposed  antenna  is
                                                              constructed as depicted in Figure 4. Figure 5 displays the
                                                              reflection  coefficients  that  were  measured  and  simulated.
                                                              The difference between the simulated and measured results
                                                              occurs  due  to  a  mismatch  in  the  soldering  and  in  the
                                                              fabrication of the proposed antenna.


                                                              Figure  5  –  Simulated  and  recorded       of  the
                                                                                                         
                                                              demonstrated antenna

                                                              3.2   Radiation Pattern
                                                              An  anechoic  chamber  is  used  to  measure  the  antenna
                                                              pattern.  Figure  6  exhibits  the  recorded  and  simulated  Co
                                                              and Cross-polarization at 3.53 GHz. The XZ  and YZ Plane
                                                              are used to show the co- and cross-polarization effects. If
                                                              the cross-polarized value is 40 to 50 dB lower than the co-
                                                              polarization,  the  antenna  is  radiating  in  the  intended
                                                              direction. Due to the biological tissues in the human body
            Figure – 3 circular slot-shaped EBG structure (a) Unit   having  lossy  properties,  several  differences  were  found
            cell (b) A 4 × 4 EBG array (c) side view of the overall   between  free  space  and  on-body  measurements.  Figure  6
                     antenna (d) boundary conditions          illustrates a nearly broadside pattern at 3.53 GHz during co-
                                                              polarization in both planes.


                                                           – 51 –
   90   91   92   93   94   95   96   97   98   99   100