
Page 90 - Kaleidoscope Academic Conference Proceedings 2024
P. 90
2024 ITU Kaleidoscope Academic Conference
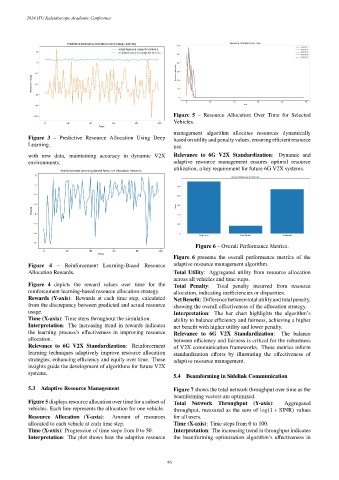
Figure 5 – Resource Allocation Over Time for Selected
Vehicles.
management algorithm allocates resources dynamically
Figure 3 – Predictive Resource Allocation Using Deep based on utility and penalty values, ensuring efficient resource
Learning. use.
with new data, maintaining accuracy in dynamic V2X Relevance to 6G V2X Standardization: Dynamic and
environments. adaptive resource management ensures optimal resource
utilization, a key requirement for future 6G V2X systems.
Figure 6 – Overall Performance Metrics.
Figure 6 presents the overall performance metrics of the
Figure 4 – Reinforcement Learning-Based Resource adaptive resource management algorithm.
Allocation Rewards. Total Utility: Aggregated utility from resource allocation
across all vehicles and time steps.
Figure 4 depicts the reward values over time for the Total Penalty: Total penalty incurred from resource
reinforcement learning-based resource allocation strategy. allocation, indicating inefficiencies or disparities.
Rewards (Y-axis): Rewards at each time step, calculated Net Benefit: Difference between total utility and total penalty,
from the discrepancy between predicted and actual resource showing the overall effectiveness of the allocation strategy.
usage. Interpretation: The bar chart highlights the algorithm’s
Time (X-axis): Time steps throughout the simulation. ability to balance efficiency and fairness, achieving a higher
Interpretation: The increasing trend in rewards indicates net benefit with higher utility and lower penalty.
the learning process’s effectiveness in improving resource Relevance to 6G V2X Standardization: The balance
allocation. between efficiency and fairness is critical for the robustness
Relevance to 6G V2X Standardization: Reinforcement of V2X communication frameworks. These metrics inform
learning techniques adaptively improve resource allocation standardization efforts by illustrating the effectiveness of
strategies, enhancing efficiency and equity over time. These adaptive resource management.
insights guide the development of algorithms for future V2X
systems.
5.4 Beamforming in Sidelink Communication
5.3 Adaptive Resource Management Figure 7 shows the total network throughput over time as the
beamforming vectors are optimized.
Figure 5 displays resource allocation over time for a subset of Total Network Throughput (Y-axis): Aggregated
vehicles. Each line represents the allocation for one vehicle. throughput, measured as the sum of log(1 + SINR) values
Resource Allocation (Y-axis): Amount of resources for all users.
allocated to each vehicle at each time step. Time (X-axis): Time steps from 0 to 100.
Time (X-axis): Progression of time steps from 0 to 50. Interpretation: The increasing trend in throughput indicates
Interpretation: The plot shows how the adaptive resource the beamforming optimization algorithm’s effectiveness in
– 46 –