
Page 171 - Kaleidoscope Academic Conference Proceedings 2021
P. 171
Connecting physical and virtual worlds
question on an immersive platform, but then showed obvious
improvement in later questions.
Figure 8 is a chart that shows the average time spent by the
participants on each question and platform. For the first three
questions (LCE), participants spent typically more time in
Aroaro. In contrast, on the next three questions (HCE)
participants on Gephi took longer on average. Participants in
Aroaro spent slightly more time on Q4 compared to the
corresponding question, Q10, in Gephi on average. They
spent much less time on Q5 and Q6 in Aroaro compared to
Q12 and Q11 in Gephi on average.
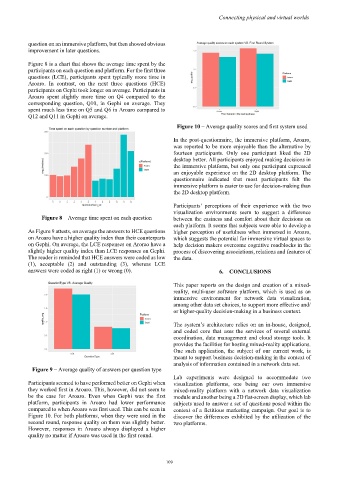
Figure 10 – Average quality scores and first system used
In the post-questionnaire, the immersive platform, Aroaro,
was reported to be more enjoyable than the alternative by
fourteen participants. Only one participant liked the 2D
desktop better. All participants enjoyed making decisions in
the immersive platform, but only one participant expressed
an enjoyable experience on the 2D desktop platform. The
questionnaire indicated that most participants felt the
immersive platform is easier to use for decision-making than
the 2D desktop platform.
Participants’ perceptions of their experience with the two
visualization environments seem to suggest a difference
Figure 8 – Average time spent on each question between the easiness and comfort about their decisions on
each platform. It seems that subjects were able to develop a
As Figure 9 attests, on average the answers to HCE questions higher perception of usefulness when immersed in Aroaro,
on Aroaro have a higher quality index than their counterparts which suggests the potential for immersive virtual spaces to
on Gephi. On average, the LCE responses on Arorao have a help decision makers overcome cognitive roadblocks in the
slightly higher quality index than LCE responses on Gephi. process of discovering associations, relations and features of
The reader is reminded that HCE answers were coded as low the data.
(1), acceptable (2) and outstanding (3), whereas LCE
answers were coded as right (1) or wrong (0). 6. CONCLUSIONS
This paper reports on the design and creation of a mixed-
reality, multi-user software platform, which is used as an
immersive environment for network data visualization,
among other data set choices, to support more effective and/
or higher-quality decision-making in a business context.
The system’s architecture relies on an in-house, designed,
and coded core that uses the services of several external
coordination, data management and cloud storage tools. It
provides the facilities for hosting mixed-reality applications.
One such application, the subject of our current work, is
meant to support business decision-making in the context of
analysis of information contained in a network data set.
Figure 9 – Average quality of answers per question type
Lab experiments were designed to accommodate two
Participants seemed to have performed better on Gephi when visualization platforms, one being our own immersive
they worked first in Aroaro. This, however, did not seem to mixed-reality platform with a network data visualization
be the case for Aroaro. Even when Gephi was the first module and another being a 2D flat-screen display, which lab
platform, participants in Aroaro had lower performance subjects used to answer a set of questions posed within the
compared to when Aroaro was first used. This can be seen in context of a fictitious marketing campaign. Our goal is to
Figure 10. For both platforms, when they were used in the discover the differences exhibited by the utilization of the
second round, response quality on them was slightly better. two platforms.
However, responses in Aroaro always displayed a higher
quality no matter if Aroaro was used in the first round.
– 109 –