
Page 67 - ITU Journal Future and evolving technologies – Volume 2 (2021), Issue 2
P. 67
ITU Journal on Future and Evolving Technologies, Volume 2 (2021), Issue 2
Table 4 – Value of each cluster and the EMR for different values ( =
∘
20 and min = −60 dBm).
1 3
Cluster Cluster power Value
5
# (i) (dBm) ( =0.1) ( =0.4) ( =0.7)
1 ‑36.02 1.00 1.00 1.00
4 2
2 ‑45.35 0.80 0.42 0.22
3 ‑47.72 0.76 0.33 0.15
4 ‑48.39 0.75 0.31 0.13
(a) (b) 5 ‑50.94 0.70 0.24 0.08
0 4.01 2.30 1.58
1 responding cluster. The value of each backup path de‑
3
5 pends on its power level relative to the strongest path in
the same measurement. Let , be the power of the ‑
th cluster and be the total number of clusters. Then, the
4 2
EMR is calculated by summing the value of the individual
paths as follows:
(c) (d) , − min
= ∑ ( ) , (14)
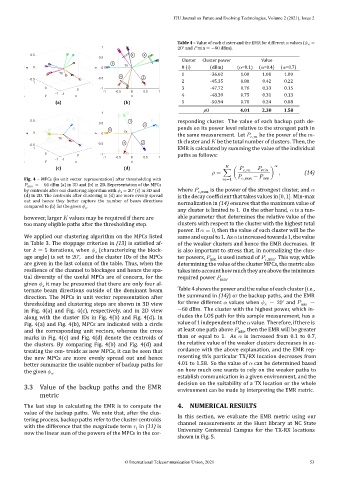
Fig. 4 – MPCs (in unit vector representation) after thresholding with =1 ,max − min
min = −60 dBm (a) in 3D and (b) in 2D. Representation of the MPCs
∘
by centroids after our clustering algorithm with = 20 (c) in 3D and where ,max is the power of the strongest cluster, and
(d) in 2D. The centroids after clustering in (d) are more evenly spread is the decay coef icient that takes values in [0, 1]. Min‑max
out and hence they better capture the number of beam directions normalization in (14) ensures that the maximum value of
compared to (b) for the given .
any cluster is limited to 1. On the other hand, is a tun‑
able parameter that determines the relative value of the
however, larger values may be required if there are
too many eligible paths after the thresholding step. clusters with respect to the cluster with the highest total
power. If = 0, then the value of each cluster will be the
We applied our clustering algorithm on the MPCs listed same and equal to 1. As is increasedtowards 1, the value
in Table 3. The stoppage criterion in (13) is satis ied af‑ of the weaker clusters and hence the EMR decreases. It
ter = 5 iterations, when (characterizing the block‑ is also important to stress that, in normalizing the clus‑
∘
age angle) is set to 20 , and the cluster IDs of the MPCs ter powers, min is used instead of ,min . This way, while
are given in the last column of the table. Thus, when the determining the value of the cluster MPCs, the metric also
resilience of the channel to blockages and hence the spa‑ takesintoaccount howmuchtheyareabovethe minimum
tial diversity of the useful MPCs are of concern, for the required power min .
given it may be presumed that there are only four al‑
ternate beam directions outside of the dominant beam Table 4 shows the power and the value of each cluster (i.e.,
the summand in (14)) or the backup paths, and the EMR
direction. The MPCs in unit vector representation after
∘
for three different values when = 20 and =
thresholding and clustering steps are shown in 3D view min
−60 dBm. The cluster with the highest power, which in‑
in Fig. 4(a) and Fig. 4(c), respectively, and in 2D view
cludes the LOS path for this sample measurement, has a
along with the cluster IDs in Fig. 4(b) and Fig. 4(d). In
Fig. 4(a) and Fig. 4(b), MPCs are indicated with a circle valueof1independentofthe value. Therefore, ifthereis
at least one path above , then the EMR will be greater
and the corresponding unit vectors, whereas the cross min
marks in Fig. 4(c) and Fig. 4(d) denote the centroids of than or equal to 1. As is increased from 0.1 to 0.7,
the clusters. By comparing Fig. 4(b) and Fig. 4(d) and the relative value of the weaker clusters decreases in ac‑
treating the cen‑ troids as new MPCs, it can be seen that cordance with the above explanation, and the EMR rep‑
the new MPCs are more evenly spread out and hence resenting this particular TX/RX location decreases from
better summarize the usable number of backup paths for 4.01 to 1.58. So the value of can be determined based
the given . on how much one wants to rely on the weaker paths to
establish communication in a given environment, and the
decision on the suitability of a TX location or the whole
3.3 Value of the backup paths and the EMR environment can be made by interpreting the EMR metric.
metric
The last step in calculating the EMR is to compute the 4. NUMERICAL RESULTS
value of the backup paths. We note that, after the clus‑
In this section, we evaluate the EMR metric using our
tering process, backup paths refer to the cluster centroids
with the difference that the magnitude term in (11) is channel measurements at the Hunt library at NC State
now the linear sum of the powers of the MPCs in the cor‑ University Centennial Campus for the TX-RX locations
shown in Fig. 5.
© International Telecommunication Union, 2021 53