
Page 63 - ITU Journal Future and evolving technologies – Volume 2 (2021), Issue 2
P. 63
ITU Journal on Future and Evolving Technologies, Volume 2 (2021), Issue 2
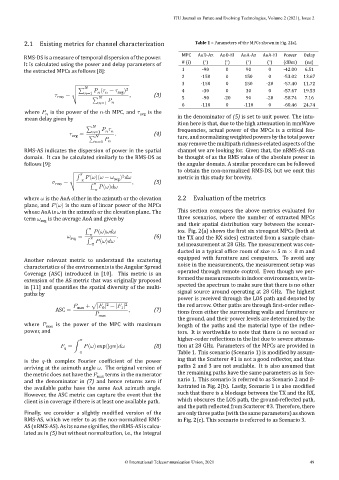
2.1 Existing metrics for channel characterization Table 1 – Parameters of the MPCs shown in Fig. 2(a).
RMS‑DS is a measure of temporal dispersion of the power. MPC AoD‑Az AoD‑El AoA‑Az AoA‑El Power Delay
∘
∘
∘
∘
It is calculated using the power and delay parameters of # (i) ( ) ( ) ( ) ( ) (dBm) (ns)
the extracted MPCs as follows [8]: 1 -90 0 90 0 ‑42.00 6.51
2 ‑150 0 150 0 ‑53.02 13.67
3 ‑150 0 150 ‑20 ‑57.40 11.72
√
√∑ ( − avg ) 2 4 ‑30 0 30 0 ‑57.67 19.53
rms = √ =1 , (3) 5 ‑90 ‑20 90 ‑20 ‑58.74 7.16
⎷ ∑ =1
6 ‑110 0 ‑110 0 ‑60.46 24.74
where is the power of the ‑th MPC, and avg is the
mean delay given by in the denominator of (5) is set to unit power. The intu‑
ition here is that, due to the high attenuation in mmWave
∑ frequencies, actual power of the MPCs is a critical fea‑
avg = =1 . (4)
∑ ture, and normalizing weighted powers by the total power
=1
may remove the multipath richness‑related aspects of the
RMS‑AS indicates the dispersion of power in the spatial channel we are looking for. Given that, the nRMS‑AS can
domain. It can be calculated similarly to the RMS‑DS as be thought of as the RMS value of the absolute power in
follows [9]: the angular domain. A similar procedure can be followed
to obtain the non‑normalized RMS‑DS, but we omit this
√ ) metric in this study for brevity.
2
√∫ ( )( −
rms = √ − avg , (5)
⎷ ∫ ( )
−
where is the AoA either in the azimuth or the elevation 2.2 Evaluation of the metrics
plane, and ( ) is the sum of linear power of the MPCs
whose AoA is in the azimuth or the elevation plane. The This section compares the above metrics evaluated for
term avg is the average AoA and given by three scenarios, where the number of extracted MPCs
and their spatial distribution vary between the scenar‑
∫ ( ) ios. Fig. 2(a) shows the irst six strongest MPCs (both at
avg = − . (6) the TX and the RX sides) extracted from a sample chan‑
∫ ( )
− nel measurement at 28 GHz. The measurement was con‑
ducted in a typical of ice room of size ≈ 5 m × 8 m and
Another relevant metric to understand the scattering equipped with furniture and computers. To avoid any
characteristics of the environments is the Angular Spread noise in the measurements, the measurement setup was
Coverage (ASC) introduced in [10]. This metric is an operated through remote control. Even though we per‑
extension of the AS metric that was originally proposed formed the measurements in indoor environments, we in‑
in [11] and quanti ies the spatial diversity of the multi‑ spected the spectrum to make sure that there is no other
paths by signal source around operating at 28 GHz. The highest
power is received through the LOS path and denoted by
+ √| | − | | 2 the red arrow. Other paths are through irst‑order re lec‑
2
ASC = max 0 1 , (7)
max tions from either the surrounding walls and furniture or
the ground, and their power levels are determined by the
where max is the power of the MPC with maximum length of the paths and the material type of the re lec‑
power, and tors. It is worthwhile to note that there is no second or
higher‑order re lections in the list due to severe attenua‑
= ∫ ( ) exp(j ) (8) tion at 28 GHz. Parameters of the MPCs are provided in
− Table 1. This scenario (Scenario 1) is modi ied by assum‑
is the ‑th complex Fourier coef icient of the power ing that the Scatterer #1 is not a good re lector, and thus
arriving at the azimuth angle . The original version of paths 2 and 3 are not available. It is also assumed that
the metric does not have the max terms in the numerator the remaining paths have the same parameters as in Sce‑
and the denominator in (7) and hence returns zero if nario 1. This scenario is referred to as Scenario 2 and il‑
the available paths have the same AoA azimuth angle. lustrated in Fig. 2(b). Lastly, Scenario 1 is also modi ied
However, the ASC metric can capture the event that the such that there is a blockage between the TX and the RX,
client is in coverage if there is at least one available path. which obscures the LOS path, the ground‑re lected path,
and the path re lected from Scatterer #3. Therefore, there
Finally, we consider a slightly modi ied version of the are only three paths (with the same parameters) as shown
RMS‑AS, which we refer to as the non‑normalized RMS‑ in Fig. 2(c). This scenario is referred to as Scenario 3.
AS (nRMS‑AS). As its name signi ies, the nRMS‑AS is calcu‑
lated as in (5) but without normalization, i.e., the integral
© International Telecommunication Union, 2021 49