
Page 71 - ITU Journal Future and evolving technologies – Volume 2 (2021), Issue 2
P. 71
ITU Journal on Future and Evolving Technologies, Volume 2 (2021), Issue 2
6 Table 6 – Mean and standard deviation of EMR for different loors and
TX1-RX1 TX2-RX8 different TX locations on the same loor. TX1&TX2 are on the second
TX1-RX14 TX3-RX10 loor, and TX4&TX5 are on the fourth loor.
4.61 TX1-RX3 TX4-RX16
5 TX1-RX2 TX4-RX15
4.01 4.14 4.31 Less emphasis TX1-RX4 TX5-RX18 EMR Floor 2 Floor 4 TX1 TX2 TX4 TX5
on weaker paths
TX2-RX12
4 mean ( ) 1.81 1.66 1.72 1.98 2.08 1.24
3.41 3.39 3.51
) 2.74 2.75 std ( ) 1.06 0.55 0.89 1.5 0.28 0.38
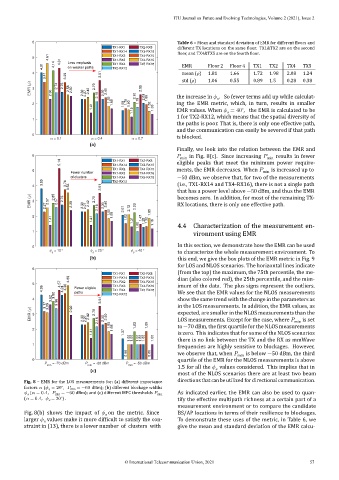
EMR ( 3 2.30 2.58 2.50 2.30 2.27 2.42 2.70 2.16 2.30 2.40 2.10 2.59 the increase in . So fewer terms add up while calculat‑
2 1.85 1.68 1.58 1.70 1.60 1.78 2.03 1.96 1.52 ing the EMR metric, which, in turn, results in smaller
1.41 1.33 ∘
1.15 EMR values. When = 40 , the EMR is calculated to be
1 for TX2‑RX12, which means that the spatial diversity of
1
the paths is poor. That is, there is only one effective path,
and the communication can easily be severed if that path
0 is blocked.
= 0.1 = 0.4 = 0.7
(a)
Finally, we look into the relation between the EMR and
6 min in Fig. 8(c). Since increasing min results in fewer
5.14 TX1-RX1 TX2-RX8 eligible peaks that meet the minimum power require‑
TX1-RX14
TX3-RX10
TX1-RX2 TX4-RX15 ments, the EMR decreases. When is increased up to
5
Fewer number TX1-RX3 TX4-RX16 min
of clusters TX1-RX4 TX5-RX18 −50 dBm, we observe that, for two of the measurements
3.80 3.74 TX2-RX12 (i.e., TX1‑RX14 and TX4‑RX16), there is not a single path
4 3.53 3.51
) 2.85 that has a power level above −50 dBm, and thus the EMR
becomes zero. In addition, for most of the remaining TX‑
EMR ( 3 2.27 2.57 2.57 2.73 2.38 2.30 2.27 2.42 2.70 2.16 2.30 2.40 2.23 RX locations, there is only one effective path.
1.85 2.07 2.12 1.85
2 1.68
1.41 1.41 1.52 1.31 1.00 1.47 1.28 1.32 1.19
1 4.4 Characterization of the measurement en‑
vironment using EMR
0 In this section, we demonstrate how the EMR can be used
= 10° = 20° = 40°
s s s to characterize the whole measurement environment. To
(b) this end, we give the box plots of the EMR metric in Fig. 9
for LOS and NLOS scenarios. The horizontal lines indicate
6
TX1-RX1 TX2-RX8 (from the top) the maximum, the 75th percentile, the me‑
4.89 TX1-RX14 TX3-RX10 dian (also colored red), the 25th percentile, and the mim‑
5 4.57 TX1-RX2 TX4-RX15 imum of the data. The plus signs represent the outliers.
TX1-RX3
TX4-RX16
4.26 4.24 4.36 Fewer eligible TX1-RX4 TX5-RX18 We see that the EMR values for the NLOS measurements
paths
3.62 3.82 TX2-RX12
4 3.51 show the same trend with the change in the parameters as
3.17 3.36
) 3.09 2.92 in the LOS measurements. In addition, the EMR values, as
EMR ( 3 2.30 2.27 2.42 2.70 2.16 2.30 2.40 expected, are smaller in the NLOS measurements than the
LOS measurements. Except for the case, where
is set
min
2 1.85 1.68 1.83 1.85 to −70 dBm, the irst quartile for the NLOS measurements
1.41 1.37 is zero. This indicates that for some of the NLOS scenarios
1.00 1.00 1.00 1.00 1.00 1.00 there is no link between the TX and the RX as mmWave
1
frequencies are highly sensitive to blockages. However,
0.00 0.00 we observe that, when min is below −50 dBm, the third
0 quartile of the EMR for the NLOS measurements is above
P = -70 dBm P = -60 dBm P = -50 dBm
min min min 1.5 for all the values considered. This implies that in
(c)
most of the NLOS scenarios there are at least two beam
directions that can be utilized for directional communication.
Fig. 8 – EMR for the LOS measurements for: (a) different importance
∘
factors ( = 20 , min = −60 dBm); (b) different blockage widths
As indicated earlier, the EMR can also be used to quan‑
( = 0.4, min = −60 dBm); and (c) different MPC thresholds min
∘
( = 0.4, = 20 ) . tify the effective multipath richness at a certain part of a
measurement environment or to compare the candidate
Fig. 8(b) shows the impact of on the metric. Since BS/AP locations in terms of their resilience to blockages.
larger values make it more dif icult to satisfy the con‑ To demonstrate these uses of the metric, in Table 6, we
straint in (13), there is a lower number of clusters with give the mean and standard deviation of the EMR calcu‑
© International Telecommunication Union, 2021 57