
Page 62 - ITU Journal Future and evolving technologies – Volume 2 (2021), Issue 2
P. 62
ITU Journal on Future and Evolving Technologies, Volume 2 (2021), Issue 2
Measurement environment TX The rest of the paper is organized as follows. Section 2
reviews a few well‑known metrics that can be used to as‑
sess wireless propagation characteristics of an environ‑
ϕ s LOS ment and motivates the need for the proposed EMR met‑
ric. Section 3 introduces the steps to calculate EMR. Sec‑
Blockage tion 4 presents the numerical results on the EMR met‑
ric using our data from a 28 GHz channel measurement
RX campaign in an indoor library environment, and Section 5
provides concluding remarks.
ϕ , P
s min
MPCs Thresholding 2. CHARACTERIZING THE CHANNEL
MPC extraction + EMR BEHAVIOR
Clustering
Information provided by the Power Delay Pro ile (PDP)
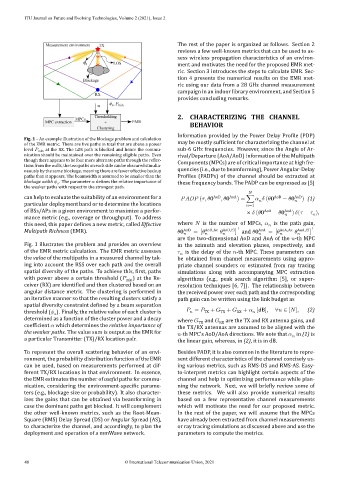
Fig. 1 – An example illustration of the blockage problem and calculation
of the EMR metric. There are ive paths in total that are above a power may be mostly suf icient for characterizing the channel at
level min at the RX. The LOS path is blocked and hence the commu‑ sub‑6 GHz frequencies. However, since the Angle of Ar‑
nication should be maintained over the remaining eligible paths. Even rival/Departure (AoA/AoD) information of the Multipath
though there appears to be four more alternate paths through the re lec‑ Components (MPCs) are of critical importance at high fre‑
tions from the walls, the two paths on each side can be obscured simulta‑
neously by the same blockage, meaning there are fewer effective backup quencies (i.e., due to beamforming), Power Angular‑Delay
paths than it appears. The beamwidth is assumed to be smaller than the Pro iles (PADPs) of the channel should be extracted at
blockage width . The parameter de ines the relative importance of these frequency bands. The PADP can be expressed as [5]
the weaker paths with respect to the strongest path.
can help to evaluate the suitability of an environment for a ( , 0 AoD , 0 AoA ) = ∑ ( 0 AoD − 0 AoD ) (1)
particular deployment band or to determine the locations =1
of BSs/APs in a given environment to maximize a perfor‑ × ( 0 AoA − 0 AoA ) ( − ),
mance metric (e.g., coverage or throughput). To address
this need, this paper de ines a new metric, called Effective where is the number of MPCs, is the path gain,
⊺
Multipath Richness (EMR). 0 AoD = [ AoD,Az AoD,El ] and 0 AoA = [ AoA,Az AoA,El ] ⊺
are the two‑dimensional AoD and AoA of the ‑th MPC
Fig. 1 illustrates the problem and provides an overview in the azimuth and elevation planes, respectively, and
of the EMR metric calculation. The EMR metric assesses is the delay of the ‑th MPC. These parameters can
the value of the multipaths in a measured channel by tak‑ be obtained from channel measurements using appro‑
ing into account the RSS over each path and the overall priate channel sounders or estimated from ray tracing
spatial diversity of the paths. To achieve this, irst, paths simulations along with accompanying MPC extraction
with power above a certain threshold ( min ) at the Re‑ algorithms (e.g., peak search algorithm [5], or super‑
ceiver (RX) are identi ied and then clustered based on an resolution techniques [6, 7]). The relationship between
angular distance metric. The clustering is performed in the received power over each path and the corresponding
an iterative manner so that the resulting clusters satisfy a path gain can be written using the link budget as
spatial diversity constraint de ined by a beam separation
threshold ( ). Finally, the relative value of each cluster is = TX + TX + RX + [dB], ∀ ∈ [ ], (2)
determined as a function of the cluster power and a decay where and are the TX and RX antenna gains, and
TX
RX
coef icient which determines the relative importance of the TX/RX antennas are assumed to be aligned with the
the weaker paths. The value sum is output as the EMR for ‑th MPC’s AoD/AoA directions. We note that in (1) is
a particular Transmitter (TX)/RX location pair. the linear gain, whereas, in (2), it is in dB.
To represent the overall scattering behavior of an envi‑ Besides PADP, it is also common in the literature to repre‑
ronment, the probability distribution function of the EMR sent different characteristics of the channel concisely us‑
can be used, based on measurements performed at dif‑ ing various metrics, such as RMS‑DS and RMS‑AS. Easy‑
ferent TX/RX locations in that environment. In essence, to‑interpret metrics can highlight certain aspects of the
the EMR estimates the number of useful paths for commu‑ channel and help in optimizing performance while plan‑
nication, considering the environment‑speci ic parame‑ ning the network. Next, we will brie ly review some of
ters (e.g., blockage size or probability). It also character‑ these metrics. We will also provide numerical results
izes the gains that can be obtained via beamforming in based on a few representative channel measurements
case the dominant paths get blocked. It will complement which will motivate the need for our proposed metric.
the other well‑known metrics, such as the Root‑Mean‑ In the rest of the paper, we will assume that the MPCs
Square (RMS) Delay Spread (DS) or Angular Spread (AS), have already been extracted from channel measurements
to characterize the channel, and accordingly, to plan the or ray tracing simulations as discussed above and use the
deployment and operation of a mmWave network. parameters to compute the metrics.
48 © International Telecommunication Union, 2021