
Page 70 - ITU Journal Future and evolving technologies – Volume 2 (2021), Issue 2
P. 70
ITU Journal on Future and Evolving Technologies, Volume 2 (2021), Issue 2
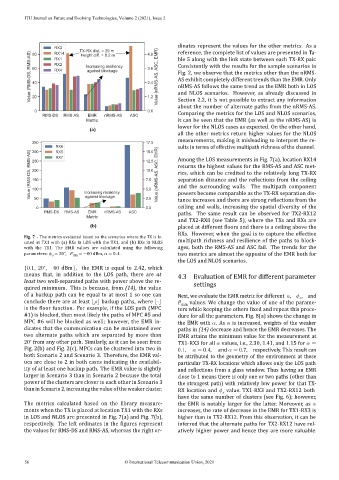
dinates represent the values for the other metrics. As a
!() $ reference, the complete list of values are presented in Ta‑
! ) !
$
- ble 5 along with the link state between each TX‑RX pair.
#* ,
- % ' (!% ' (!#! % + #* ,%
Consistently with the results for the sample scenarios in
Fig. 2, we observe that the metrics other than the nRMS‑
!%() #& "
AS exhibit completely different trends than the EMR. Only
nRMS‑AS follows the same trend as the EMR both in LOS
Section 2.2, it is not possible to extract any information
and NLOS scenarios. However, as already discussed in
about the number of alternate paths from the nRMS‑AS.
Comparing the metrics for the LOS and NLOS scenarios,
%
it can be seen that the EMR (as well as the nRMS‑AS) is
)'!
lower for the NLOS cases as expected. On the other hand,
(a)
all the other metrics return higher values for the NLOS
measurements, making it misleading to interpret the re‑
sults in terms of effective multipath richness of the channel.
% Among the LOS measurements in Fig. 7(a), location RX14
" $
% " $ returns the highest values for the RMS‑AS and ASC met‑
rics, which can be credited to the relatively long TX‑RX
separation distance and the re lections from the ceiling
and the surrounding walls. The multipath component
# powers become comparable as the TX‑RX separation dis‑
!
tance increases and there are strong re lections from the
ceiling and walls, increasing the spatial diversity of the
paths. The same result can be observed for TX2‑RX12
!
and TX2‑RX8 (see Table 5), where the TXs and RXs are
(b) placed at different loors and there is a ceiling above the
RXs. However, when the goal is to capture the effective
Fig. 7 – The metrics evaluated based on the scenarios where the TX is lo‑
multipath richness and resilience of the paths to block‑
cated at TX1 with (a) RXs in LOS with the TX1, and (b) RXs in NLOS
with the TX1. The EMR values are calculated using the following ages, both the RMS‑AS and ASC fail. The trends for the
∘
parameters: = 20 , min = −60 dBm, = 0.4. two metrics are almost the opposite of the EMR both for
the LOS and NLOS scenarios.
∘
{0.1, 20 , −60 dBm}, the EMR is equal to 2.42, which
means that, in addition to the LOS path, there are at 4.3 Evaluation of EMR for different parameter
least two well‑separated paths with power above the re‑ settings
quired minimum. This is because, from (14), the value
of a backup path can be equal to at most 1 so one can Next, we evaluate the EMR metric for different , , and
conclude there are at least ⌊ ⌋ backup paths, where ⌊⋅⌋ values. We change the value of one of the parame‑
min
is the loor function. For example, if the LOS path (MPC ters while keeping the others ixed and repeat this proce‑
#1) is blocked, then most likely the paths of MPC #5 and dure for all the parameters. Fig. 8(a) shows the change in
MPC #6 will be blocked as well; however, the EMR in‑ the EMR with . As is increased, weights of the weaker
dicates that the communication can be maintained over paths in (14) decrease and hence the EMR decreases. The
two alternate paths which are separated by more than EMR attains the minimum value for the measurement at
∘
20 from any other path. Similarly, as it can be seen from TX1‑RX3 for all values, i.e., 2.30, 1.41, and 1.15 for =
Fig. 2(b) and Fig. 2(c), MPCs can be clustered into two in 0.1 , = 0.4 , and = 0.7 , respectively. This result can
both Scenario 2 and Scenario 3. Therefore, the EMR val‑ be attributed to the geometry of the environment at these
ues are close to 2 in both cases indicating the availabil‑ particular TX‑RX locations which allows only the LOS path
ity of at least one backup path. The EMR value is slightly and re lections from a glass window. Thus having an EMR
larger in Scenario 3 than in Scenario 2 because the total close to 1 means there is only one or two paths (other than
power of the clusters are closer to each other in Scenario 3 the strongest path) with relatively low power for that TX‑
than in Scenario 2, increasing the value of the weaker cluster. RX location and value. TX1‑RX3 and TX2‑RX12 both
have the same number of clusters (see Fig. 6); however,
The metrics calculated based on the library measure‑ the EMR is notably larger for the latter. Moreover, as
ments when the TX is placed at location TX1 with the RXs increases, the rate of decrease in the EMR for TX1‑RX3 is
in LOS and NLOS are presented in Fig. 7(a) and Fig. 7(b), higher than in TX2‑RX12. From this observation, it can be
respectively. The left ordinates in the igures represent inferred that the alternate paths for TX2‑RX12 have rel‑
the values for RMS‑DS and RMS‑AS, whereas the right or‑ atively higher power and hence they are more valuable.
56 © International Telecommunication Union, 2021