
Page 64 - ITU Journal Future and evolving technologies – Volume 2 (2021), Issue 2
P. 64
ITU Journal on Future and Evolving Technologies, Volume 2 (2021), Issue 2
TX Scatterer #2 Scatterer #2 Scatterer #2
Scatterer #1 Scatterer #1
LOS path LOS path
Fixed
y (m) y (m) y (m) blockage
MPC #1
MPC #2
RX
MPC #3
MPC #1
MPC #4 MPC #4 MPC #2
Scatterer #3 MPC #5 Scatterer #3 MPC #5 MPC #3
MPC #6 MPC #6 MPC #4
x (m) x (m) x (m)
(a) Scenario 1 (b) Scenario 2 (c) Scenario 3
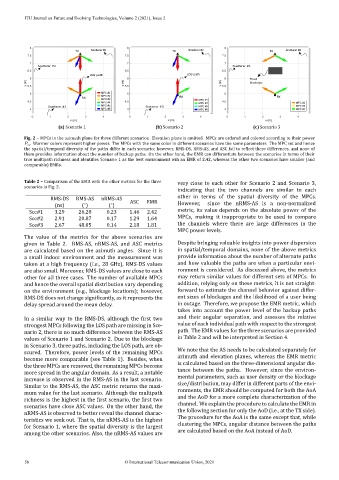
Fig. 2 – MPCs in the azimuth plane for three different scenarios. Elevation plane is omitted. MPCs are ordered and colored according to their power
. Warmer colors represent higher power. The MPCs with the same color in different scenarios have the same parameters. The MPC set and hence
the spatial/temporal diversity of the paths differ in each scenario; however, RMS‑DS, RMS‑AS, and ASC fail to re lect these differences, and none of
them provides information about the number of backup paths. On the other hand, the EMR can differentiate between the scenarios in terms of their
true multipath richness and identi ies Scenario 1 as the best environment wih an EMR of 2.42, whereas the other two scenarios have smaller (and
comparable) EMRs.
Table 2 – Comparison of the EMR with the other metrics for the three very close to each other for Scenario 2 and Scenario 3,
scenarios in Fig. 2.
indicating that the two channels are similar to each
RMS‑DS RMS‑AS nRMS‑AS other in terms of the spatial diversity of the MPCs.
∘
∘
(ns) ( ) ( ) ASC EMR However, since the nRMS‑AS is a non‑normalized
Sce#1 3.29 26.28 0.23 1.46 2.42 metric, its value depends on the absolute power of the
Sce#2 2.91 20.87 0.17 1.29 1.64 MPCs, making it inappropriate to be used to compare
Sce#3 2.67 48.05 0.14 2.18 1.81 the channels where there are large differences in the
MPC power levels.
are
given in Table 2. RMS‑AS, nRMS‑AS, and ASC metrics Despite bringing valuable insights into power dispersion
are calculated based on the azimuth angles. Since it is in spatial/temporal domains, none of the above metrics
a small indoor environment and the measurement was provide information about the number of alternate paths
taken at a high frequency (i.e., 28 GHz), RMS‑DS values and how valuable the paths are when a particular envi‑
are also small. Moreover, RMS‑DS values are close to each ronment is considered. As discussed above, the metrics
other for all three cases. The number of available MPCs may return similar values for different sets of MPCs. In
and hence the overall spatial distribution vary depending addition, relying only on these metrics, it is not straight‑
on the environment (e.g., blockage locations); however, forward to estimate the channel behavior against differ‑
RMS‑DS does not change signi icantly, as it represents the ent sizes of blockages and the likelihood of a user being
delay spread around the mean delay. in outage. Therefore, we propose the EMR metric, which
takes into account the power level of the backup paths
In a similar way to the RMS‑DS, although the irst two and their angular separation, and assesses the relative
strongest MPCs following the LOS path are missing in Sce‑ value of each individual path with respect to the strongest
nario 2, there is no much difference between the RMS‑AS path. The EMR values for the three scenarios are provided
in Table 2 and will be interpreted in Section 4.
values of Scenario 1 and Scenario 2. Due to the blockage
in Scenario 3, three paths, including the LOS path, are ob‑
We note that the AS needs to be calculated separately for
scured. Therefore, power levels of the remaining MPCs
azimuth and elevation planes, whereas the EMR metric
become more comparable (see Table 1). Besides, when
is calculated based on the three‑dimensional angular dis‑
the three MPCs are removed, the remaining MPCs become
tance between the paths. However, since the environ‑
more spread in the angular domain. As a result, a notable
mental parameters, such as user density or the blockage
increase is observed in the RMS‑AS in the last scenario.
size/distribution, may differ in different parts of the envi‑
Similar to the RMS‑AS, the ASC metric returns the maxi‑
ronments, the EMR should be computed for both the AoA
mum value for the last scenario. Although the multipath
and the AoD for a more complete characterization of the
richness is the highest in the irst scenario, the irst two
channel. We explain the procedure to calculate the EMR in
scenarios have close ASC values. On the other hand, the
the following section for only the AoD (i.e., at the TX side).
nRMS‑AS is observed to better reveal the channel charac‑
The procedure for the AoA is the same except that, while
teristics we seek out. That is, the nRMS‑AS is the highest
clustering the MPCs, angular distance between the paths
for Scenario 1, where the spatial diversity is the largest
are calculated based on the AoA instead of AoD.
among the other scenarios. Also, the nRMS‑AS values are
50 © International Telecommunication Union, 2021