
Page 69 - ITU Journal Future and evolving technologies – Volume 2 (2021), Issue 2
P. 69
ITU Journal on Future and Evolving Technologies, Volume 2 (2021), Issue 2
Table 5 – Evaluation of the metrics for the library channel measurements.
Location Link State RMS‑DS RMS‑AS nRMS‑AS ASC EMR
TX1‑RX1 LOS 32.10 30.15 0.56 1.74 2.30
TX1‑RX14 LOS 29.90 81.58 0.46 5.46 2.27
TX1‑RX2 LOS 38.93 48.69 0.54 1.84 2.42
TX1‑RX3 LOS 34.42 63.17 0.40 2.80 1.41
TX1‑RX4 LOS 36.61 49.82 0.65 1.93 2.70
TX2‑RX12 LOS 37.50 92.38 0.71 4.50 1.86
TX2‑RX8 LOS 29.08 154.60 1.61 3.98 3.25
TX3‑RX10 LOS 44.40 53.55 0.46 3.19 1.43
TX4‑RX15 LOS 27.53 38.89 0.86 2.62 2.40
TX4‑RX16 LOS 32.52 72.82 0.67 9.06 1.85
TX5‑RX18 LOS 29.93 88.68 1.30 3.32 2.23
TX1‑RX5 NLOS 33.91 93.95 0.36 3.55 1.30
TX1‑RX6 NLOS 49.74 109.00 0.06 16.86 0.00
TX1‑RX7 NLOS 41.33 54.09 0.42 3.95 1.33
TX2‑RX13 NLOS 62.21 41.30 0.09 7.23 0.00
TX2‑RX9 NLOS 25.31 67.49 0.93 2.39 2.03
TX3‑RX11 NLOS 59.99 71.35 0.03 7.50 0.00
TX5‑RX17 NLOS 47.03 50.82 0.13 3.211 1.00
TX5‑RX19 NLOS 38.28 75.10 0.53 3.34 1.04
6
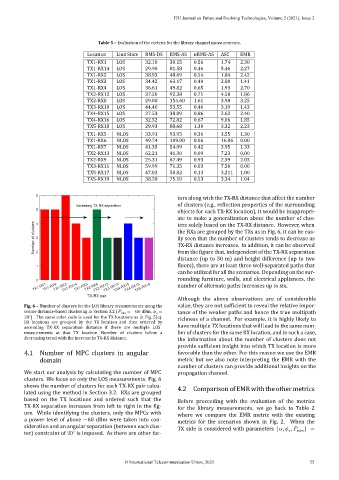
tors along with the TX‑RX distance that affect the number
Increasing TX-RX separation of clusters (e.g., re lection properties of the surrounding
5
objects for each TX‑RX location), it would be inappropri‑
ate to make a generalization about the number of clus‑
Number of clusters 3 the RXs are grouped by the TXs as in Fig. 6, it can be eas‑
4
ters solely based on the TX‑RX distance. However, when
ily seen that the number of clusters tends to decrease as
TX‑RX distance increases. In addition, it can be observed
from the igure that, independent of the TX‑RX separation
2
distance (up to 50 m) and height difference (up to two
1 loors), there are at least three well‑separated paths that
can be utilized for all the scenarios. Depending on the sur‑
0 rounding furniture, walls, and electrical appliances, the
TX5-RX18
TX2-RX12
TX1-RX1 TX1-RX4 TX1-RX2 TX1-RX3 TX2-RX8 TX3-RX10 TX4-RX16 number of alternate paths increases up to six.
TX1-RX14
TX4-RX15
TX-RX pair
Although the above observations are of considerable
Fig. 6 – Number of clusters for the LOS library measurements using the value, they are not suf icient to reveal the relative impor‑
cosine distance‑based clustering in Section 3.2 ( m in = −60 dBm, = tance of the weaker paths and hence the true multipath
∘
20 ) . The same color code is used for the TX locations as in Fig. 5(a). richness of a channel. For example, it is highly likely to
RX locations are grouped by the TX location and then ordered by
have multiple TX locations that will lead to the same num‑
ascending TX‑RX separation distance if there are multiple LOS
measurements at that TX location. Number of clusters follow a ber of clusters for the same RX location, and in such a case,
decreasing trend with the increase in TX‑RX distance.
the information about the number of clusters does not
provide suf icient insight into which TX location is more
4.1 Number of MPC clusters in angular favorable than the other. For this reason we use the EMR
domain metric but we also note interpreting the EMR with the
number of clusters can provide additional insights on the
We start our analysis by calculating the number of MPC propagation channel.
clusters. We focus on only the LOS measurements. Fig. 6
shows the number of clusters for each TX‑RX pair calcu‑ 4.2 Comparison of EMR with the other metrics
lated using the method in Section 3.2. RXs are grouped
based on the TX locations and ordered such that the Before proceeding with the evaluation of the metrics
TX‑RX separation increases from left to right in the ig‑ for the library measurements, we go back to Table 2
ure. While identifying the clusters, only the MPCs with where we compare the EMR metric with the existing
a power level of above −60 dBm were taken into con‑ metrics for the scenarios shown in Fig. 2. When the
sideration and an angular separation (between each clus‑ TX side is considered with parameters { , , } =
∘
ter) constraint of 20 is imposed. As there are other fac‑ min
© International Telecommunication Union, 2021 55