
Page 187 - Kaleidoscope Academic Conference Proceedings 2020
P. 187
Industry-driven digital transformation
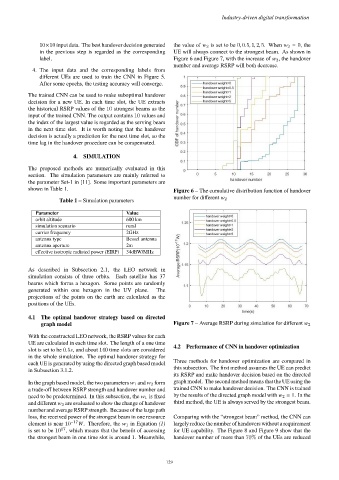
10×10 input data. The best handover decision generated the value of w 2 is set to be 0, 0.5, 1, 2, 5. When w 2 = 0, the
in the previous step is regarded as the corresponding UE will always connect to the strongest beam. As shown in
label. Figure 6 and Figure 7, with the increase of w 2 , the handover
number and average RSRP will both decrease.
4. The input data and the corresponding labels from
different UEs are used to train the CNN in Figure 5.
After some epochs, the testing accuracy will converge.
The trained CNN can be used to make suboptimal handover
decision for a new UE. In each time slot, the UE extracts
the historical RSRP values of the 10 strongest beams as the
input of the trained CNN. The output contains 10 values and
the index of the largest value is regarded as the serving beam
in the next time slot. It is worth noting that the handover
decision is actually a prediction for the next time slot, so the
time lag in the handover procedure can be compensated.
4. SIMULATION
The proposed methods are numerically evaluated in this
section. The simulation parameters are mainly referred to
the parameter Set-1 in [11]. Some important parameters are
shown in Table 1. Figure 6 – The cumulative distribution function of handover
Table 1 – Simulation parameters number for different w 2
Parameter Value
orbit altitude 600 km
simulation scenario rural
carrier frequency 2GHz
antenna type Bessel antenna
antenna aperture 2m
effective isotropic radiated power (EIRP) 34dBW/MHz
As described in Subsection 2.1, the LEO network in
simulation consists of three orbits. Each satellite has 37
beams which forms a hexagon. Some points are randomly
generated within one hexagon in the UV plane. The
projections of the points on the earth are calculated as the
positions of the UEs.
4.1 The optimal handover strategy based on directed
graph model Figure 7 – Average RSRP during simulation for different w 2
With the constructed LEO network, the RSRP values for each
UE are calculated in each time slot. The length of a one time
slot is set to be 0.5s, and about 140 time slots are considered 4.2 Performance of CNN in handover optimization
in the whole simulation. The optimal handover strategy for
each UE is generated by using the directed graph based model Three methods for handover optimization are compared in
in Subsection 3.1.2. this subsection. The first method assumes the UE can predict
its RSRP and make handover decision based on the directed
In the graph based model, the two parameters w 1 and w 2 form graph model. The second method means that the UE using the
a trade-off between RSRP strength and handover number and trained CNN to make handover decision. The CNN is trained
need to be predetermined. In this subsection, the w 1 is fixed by the results of the directed graph model with w 2 = 1. In the
and different w 2 are evaluated to show the change of handover third method, the UE is always served by the strongest beam.
number and average RSRP strength. Because of the large path
loss, the received power of the strongest beam in one resource Comparing with the “strongest beam” method, the CNN can
element is near 10 −17 W. Therefore, the w 1 in Equation (1) largely reduce the number of handovers without a requirement
is set to be 10 , which means that the benefit of accessing for UE capability. The Figure 8 and Figure 9 show that the
17
the strongest beam in one time slot is around 1. Meanwhile, handover number of more than 70% of the UEs are reduced
– 129 –