
Page 185 - Kaleidoscope Academic Conference Proceedings 2020
P. 185
Industry-driven digital transformation
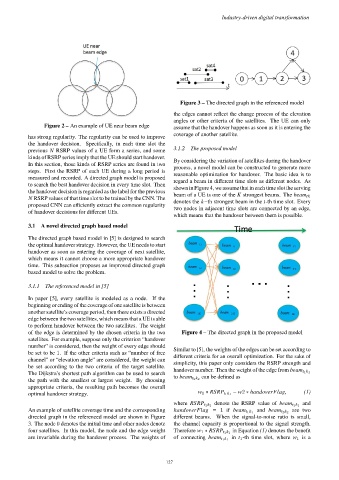
Figure 3 – The directed graph in the referenced model
the edges cannot reflect the change process of the elevation
angles or other criteria of the satellites. The UE can only
Figure 2 – An example of UE near beam edge assume that the handover happens as soon as it is entering the
has strong regularity. The regularity can be used to improve coverage of another satellite.
the handover decision. Specifically, in each time slot the
previous N RSRP values of a UE form a series, and some 3.1.2 The proposed model
kinds of RSRP series imply that the UE should start handover. By considering the variation of satellites during the handover
In this section, those kinds of RSRP series are found in two process, a novel model can be constructed to generate more
steps. First the RSRP of each UE during a long period is reasonable optimization for handover. The basic idea is to
measured and recorded. A directed graph model is proposed regard a beam in different time slots as different nodes. As
to search the best handover decision in every time slot. Then shown in Figure 4, we assume that in each time slot the serving
the handover decision is regarded as the label for the previous
N RSRP values of that time slot to be trained by the CNN. The beam of a UE is one of the K strongest beams. The beam tk
denotes the k−th strongest beam in the t-th time slot. Every
proposed CNN can efficiently extract the common regularity two nodes in adjacent time slots are connected by an edge,
of handover decisions for different UEs. which means that the handover between them is possible.
3.1 A novel directed graph based model
The directed graph based model in [5] is designed to search
the optimal handover strategy. However, the UE needs to start
handover as soon as entering the coverage of next satellite,
which means it cannot choose a more appropriate handover
time. This subsection proposes an improved directed graph
based model to solve the problem.
3.1.1 The referenced model in [5]
In paper [5], every satellite is modeled as a node. If the
beginning or ending of the coverage of one satellite is between
another satellite’s coverage period, then there exists a directed
edge between the two satellites, which means that a UE is able
to perform handover between the two satellites. The weight
of the edge is determined by the chosen criteria in the two Figure 4 – The directed graph in the proposed model
satellites. For example, suppose only the criterion “handover
number” is considered, then the weight of every edge should Similar to [5], the weights of the edges can be set according to
be set to be 1. If the other criteria such as “number of free different criteria for an overall optimization. For the sake of
channel” or “elevation angle” are considered, the weight can simplicity, this paper only considers the RSRP strength and
be set according to the two criteria of the target satellite.
The Dijkstra’s shortest path algorithm can be used to search handover number. Then the weight of the edge from beam t 1 k 1
can be defined as
the path with the smallest or largest weight. By choosing to beam t 2 k 2
appropriate criteria, the resulting path becomes the overall
optimal handover strategy. w 1 ∗ RSRP t 1 k 1 − w2 ∗ handoverFlag, (1)
and
where RSRP t 1 k 1 denote the RSRP value of beam t 1 k 1
An example of satellite coverage time and the corresponding handoverFlag = 1 if beam t 1 k 1 and beam t 2 k 2 are two
directed graph in the referenced model are shown in Figure different beams. When the signal-to-noise ratio is small,
3. The node 0 denotes the initial time and other nodes denote the channel capacity is proportional to the signal strength.
four satellites. In this model, the node and the edge weight Therefore w 1 ∗ RSRP t 1 k 1 in Equation (1) denotes the benefit
are invariable during the handover process. The weights of of connecting beam t 1 k 1 in t 1 -th time slot, where w 1 is a
– 127 –