
Page 89 - ITU Journal - ICT Discoveries - Volume 1, No. 2, December 2018 - Second special issue on Data for Good
P. 89
ITU JOURNAL: ICT Discoveries, Vol. 1(2), December 2018
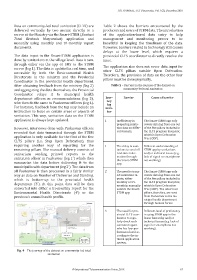
Data on community-led total sanitation (CLTS) are Table 2 shows the barriers encountered by the
delivered vertically by two means: directly to a producers and users of STBM data. The introduction
server at the Ministry via the Smart-STBM (Sanitasi of the application-based data entry to help
Total Berbasis Masyarakat) application and management and monitoring proves to be
manually using monthly and tri-monthly report beneficial in keeping the timeliness of the data.
documents. However, barriers related to technology still causes
delays at the lower level, which requires a
The data input in the Smart-STBM application is provincial CLTS coordinator to directly resolve the
done by sanitarians at the village level. Data is sent issue.
through either via the app or SMS to the STBM
server (leg 1). The data is updated in real time, and The application also does not cover data input for
other CLTS pillars outside Open Defecation.
accessible by both the Environmental Health
Directorate in the ministry and the Provincial Therefore, the provision of data on the other four
Coordinator in the provincial health department. pillars must be done physically.
After obtaining feedback from the ministry (leg 2) Table 2 – Barriers in the journey of the dataset on
and aggregating the data themselves, the Provincial community-led total sanitation
Coordinator relays it to municipal health
department officers as recommendations (leg 3), Jour- Barrier Cause of barrier
who then do the same to Puskesmas officers (leg 4). ney
leg
For instance, feedback from the top may include an num-
instruction to focus on certain areas or aspects of ber
sanitation. This way, sanitation data on the STBM
application is always kept updated. 1 Inefficiency in The Smart-STBM app only
preparing sanita- covers data log from one out
However, interviews done with Puskesmas officers tion data on differ- of the five pillars included in
revealed that data transacted through the STBM ent formats. the CLTS program blueprint,
application is only available for the first of the five which is Open Defecation
Free (ODF).
CLTS pillars (i.e. Stop Open Defecation), thus
requiring another way of reporting for the 1 The delay in sani- Different understanding of
remaining pillars. The manual delivery consists of tarians to send off STBM app by sanitarians
sanitarians sending printed reports to the real-time infor- and/or technical issues (e.g.
sanitation officer in Puskesmas (leg 1’) which then mation through lack of signal or smartphone
not working)
the Smart-STBM
summarize the data before delivering it to the app.
municipal health department (leg 2’). The data from
all Puskesmas is then processed in a fairly similar 2’ The need to trans- The Smart-STBM app only
way as data on Number of Deliveries and Stunting, act sanitation re- covers data log from one out
which is bottom-up to the provincial health ports, either of the five pillars included in
department (3’). At this point, data will be then monthly or tri- the CLTS program blueprint,
monthly, manually which is Open Defecation
converted into either a tri-monthly report for the outside the Smart- Free (ODF). The other four
Environmental Health Directorate (4’) or the STBM app. pillars, therefore, are sent
province’s annual health profile. from Puskesmas to the mu-
nicipal health department
through manual forms.
3 The need for pro- Different level of proficiency
vincial CLTS coor- in using STBM app in the
dinator to regu- lower hierarchy and/or
larly check each technical issues (e.g. lack of
sanitation agent signal or smartphone not
who has low-per- working).
formance level ac-
cording to the in-
ternal application
system.
Fig. 4 – The journey of the dataset on community-led total
sanitation
© International Telecommunication Union, 2018 67