
Page 87 - ITU Journal - ICT Discoveries - Volume 1, No. 2, December 2018 - Second special issue on Data for Good
P. 87
ITU JOURNAL: ICT Discoveries, Vol. 1(2), December 2018
• An actor is a person or IT system that inter- Ministry of
acts with the container. The actor may create, Health
consume or transform the data resting in the
container. The actor is denoted using the ac- Provincial Health
Department
tor symbol of the UML notation and the inter- (Provincial
Dinkes)
action with the containers is shown with a
dotted arrow beginning from the actor and Municipal Health
Department (City
ending with the container with which he or Dinkes)
she interacts. Several actors can interact with
one container. One actor can also have several Private Clinics Health Center Hospitals
Community
interactions with different actions with the (Puskesmas)
same container.
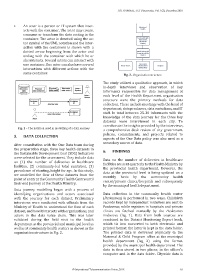
Fig. 2– Organisation structure
The study utilized a qualitative approach, in which
in-depth interviews and observation of key
informants responsible for data management at
each level of the Health Department organisation
structure were the primary methods for data
collection. These include meetings with the head of
department, data producers, data custodians, and IT
staff. In total between 25-30 informants with the
knowledge of the data journey for the three key
datasets were interviewed in each city. To
corroborate the insights provided by the interviews,
Fig. 1 – The notation used in modelling of a data journey
a comprehensive desk review of city government
5. DATA COLLECTION policies, commitments, and projects related to
aspects of the One Data policy was also used as a
After consultation with the One Data team during secondary source of data.
the preparation stage, three key health datasets in 6. FINDINGS
the Sustainable Development Goal (SDG) indicators
were selected for the assessment. They include data Data on the number of deliveries in healthcare
on (1) the number of deliveries in healthcare
facilities, (2) community-led total sanitation, (3) facilities are sent quarterly to the Health Ministry by
prevalence of stunting, height for age. In this study, the provincial health department. However, the
we modelled the flow of these datasets from the data at the provincial level is being updated on a
basis
the
community
health
monthly
by
point of entry at the Community Health Centre until center/private clinics/hospitals and subsequently
their end journey at the Health Ministry.
by the municipal health department.
Data journey modelling began with a process of
identifying organisations and actors associated Data collection in the community health center
with the journey for each dataset. Preliminary (Puskesmas) is performed in two ways. Childbirth
interviews were conducted with officials from the records kept by independent midwives are sent to
Ministry of Health to understand the flow of each Puskesmas, while registers in hospitals and private
dataset, and how it interacts with organisations, and clinics are fetched manually by the Puskesmas
actors in the data value chain. This was later midwives (leg 1). Data from both sources are
validated during the field visit to the health combined in the District Monitoring Report book,
department at the provincial and municipal level as which tis hen converted to both electronic and
well as at community health centers as shown in the printed format; the latter is kept in the data folder.
organisation structure in Fig. 2. The printed data is delivered physically to the
Maternal & Child Program office at the municipal
health department (leg 2) using the format
provided by the municipal health department. The
data is then stored in two places; in the officer’s
computer and in the data folder. Citywide data is
© International Telecommunication Union, 2018 65