
Page 58 - U4SSC Collection Methodology for Key Performance Indicators for Smart Sustainable Cities
P. 58
Collection Methodology for Key Performance Indicators for Smart Sustainable Cities
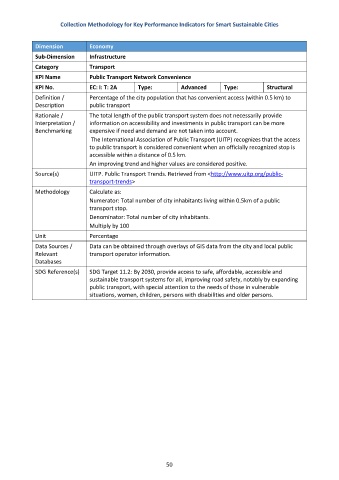
Dimension Economy
Sub-Dimension Infrastructure
Category Transport
KPI Name Public Transport Network Convenience
KPI No. EC: I: T: 2A Type: Advanced Type: Structural
Definition / Percentage of the city population that has convenient access (within 0.5 km) to
Description public transport
Rationale / The total length of the public transport system does not necessarily provide
Interpretation / information on accessibility and investments in public transport can be more
Benchmarking expensive if need and demand are not taken into account.
The International Association of Public Transport (UITP) recognizes that the access
to public transport is considered convenient when an officially recognized stop is
accessible within a distance of 0.5 km.
An improving trend and higher values are considered positive.
Source(s) UITP. Public Transport Trends. Retrieved from <http://www.uitp.org/public-
transport-trends>
Methodology Calculate as:
Numerator: Total number of city inhabitants living within 0.5km of a public
transport stop.
Denominator: Total number of city inhabitants.
Multiply by 100
Unit Percentage
Data Sources / Data can be obtained through overlays of GIS data from the city and local public
Relevant transport operator information.
Databases
SDG Reference(s) SDG Target 11.2: By 2030, provide access to safe, affordable, accessible and
sustainable transport systems for all, improving road safety, notably by expanding
public transport, with special attention to the needs of those in vulnerable
situations, women, children, persons with disabilities and older persons.
50