
Page 419 - Kaleidoscope Academic Conference Proceedings 2024
P. 419
Innovation and Digital Transformation for a Sustainable World
[2] P. S. Bithas, V. Nikolaidis, A. G. Kanatas, and G. K. Karagiannidis,
“Uav-to-ground communications: Channel modeling and uav selection,”
IEEE Transactions on Communications, vol. 68, no. 8, pp. 5135–5144,
2020.
[3] G. K. Kurt, M. G. Khoshkholgh, S. Alfattani, A. Ibrahim, T. S. Darwish,
M. S. Alam, H. Yanikomeroglu, and A. Yongacoglu, “A vision and
framework for the high altitude platform station (haps) networks of the
future,” IEEE Communications Surveys & Tutorials, vol. 23, no. 2, pp.
729–779, 2021.
[4] X. Cao, P. Yang, M. Alzenad, X. Xi, D. Wu, and H. Yanikomeroglu,
“Airborne communication networks: A survey,” IEEE Journal on Se-
lected Areas in Communications, vol. 36, no. 9, pp. 1907–1926, 2018.
[5] M. Mozaffari, W. Saad, M. Bennis, and M. Debbah, “Efficient de-
ployment of multiple unmanned aerial vehicles for optimal wireless
coverage,” IEEE Communications Letters, vol. 20, no. 8, pp. 1647–1650,
2016.
[6] S. Yin, Y. Zhao, and L. Li, “Resource allocation and base station
placement in cellular networks with wireless powered uavs,” IEEE
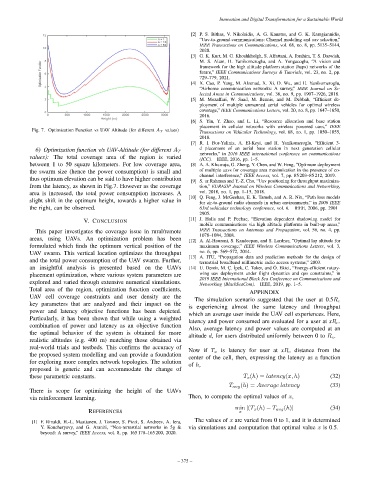
Fig. 7. Optimization Function vs UAV Altitude (for different A T values)
Transactions on Vehicular Technology, vol. 68, no. 1, pp. 1050–1055,
2018.
[7] R. I. Bor-Yaliniz, A. El-Keyi, and H. Yanikomeroglu, “Efficient 3-
d placement of an aerial base station in next generation cellular
6) Optimization function v/s UAV-Altitude (for different A T
networks,” in 2016 IEEE international conference on communications
values): The total coverage area of the region is varied
(ICC). IEEE, 2016, pp. 1–5.
between 1 to 50 square kilometers. For low coverage area, [8] A. A. Khuwaja, G. Zheng, Y. Chen, and W. Feng, “Optimum deployment
the swarm size (hence the power consumption) is small and of multiple uavs for coverage area maximization in the presence of co-
channel interference,” IEEE Access, vol. 7, pp. 85 203–85 212, 2019.
thus optimum elevation can be said to have higher contribution
[9] S. ur Rahman and Y.-Z. Cho, “Uav positioning for throughput maximiza-
from the latency, as shown in Fig.7. However as the coverage tion,” EURASIP Journal on Wireless Communications and Networking,
area is increased, the total power consumption increases. A vol. 2018, no. 1, pp. 1–15, 2018.
[10] Q. Feng, J. McGeehan, E. K. Tameh, and A. R. Nix, “Path loss models
slight shift in the optimum height, towards a higher value in
for air-to-ground radio channels in urban environments,” in 2006 IEEE
the right, can be observed. 63rd vehicular technology conference, vol. 6. IEEE, 2006, pp. 2901–
2905.
[11] J. Holis and P. Pechac, “Elevation dependent shadowing model for
V. CONCLUSION
mobile communications via high altitude platforms in built-up areas,”
This paper investigates the coverage issue in rural/remote IEEE Transactions on Antennas and Propagation, vol. 56, no. 4, pp.
1078–1084, 2008.
areas, using UAVs. An optimization problem has been [12] A. Al-Hourani, S. Kandeepan, and S. Lardner, “Optimal lap altitude for
formulated which finds the optimum vertical position of the maximum coverage,” IEEE Wireless Communications Letters, vol. 3,
UAV swarm. This vertical location optimizes the throughput no. 6, pp. 569–572, 2014.
[13] A. ITU, “Propagation data and prediction methods for the design of
and the total power consumption of the UAV swarm. Further, terrestrial broadband millimetric radio access systems,” 2003.
an insightful analysis is presented based on the UAVs [14] U. Demir, M. C. ˙ Ipek, C. Toker, and ¨ O. Ekici, “Energy-efficient rotary-
¸
placement optimization, where various system parameters are wing uav deployment under flight dynamics and qos constraints,” in
2019 IEEE International Black Sea Conference on Communications and
explored and varied through extensive numerical simulations. Networking (BlackSeaCom). IEEE, 2019, pp. 1–5.
Total area of the region, optimization function coefficients,
APPENDIX
UAV cell coverage constraints and user density are the
The simulation scenario suggested that the user at 0.5R c
key parameters that are analyzed and their impact on the
is experiencing almost the same latency and throughput
power and latency objective functions has been depicted.
which an average user inside the UAV cell experiences. Here,
Particularly, it has been shown that while using a weighted
latency and power consumed are evaluated for a user at xR c .
combination of power and latency as an objective function
Also, average latency and power values are computed at an
the optimal behavior of the system is obtained for more
altitude d, for users distributed uniformly between 0 to R c .
realistic altitudes (e.g. 400 m) matching those obtained via
real-world trials and testbeds. This confirms the accuracy of
Now if T x is latency for user at xR c distance from the
the proposed system modelling and can provide a foundation
center of the cell, then, expressing the latency as a function
for exploring more complex network topologies. The solution
of h,
proposed is generic and can accommodate the change of
these parametric constants. T x (h) = latency(x, h) (32)
T avg (h) = Average latency (33)
There is scope for optimizing the height of the UAVs
via reinforcement learning. Then, to compute the optimal values of x,
min |(T x (h) − T avg (h)| (34)
REFERENCES x
[1] F. Rinaldi, H.-L. Maattanen, J. Torsner, S. Pizzi, S. Andreev, A. Iera, The values of x are varied from 0 to 1, and it is determined
Y. Koucheryavy, and G. Araniti, “Non-terrestrial networks in 5g & via simulations and computation that optimal value x is 0.5.
beyond: A survey,” IEEE Access, vol. 8, pp. 165 178–165 200, 2020.
– 375 –