
Page 414 - Kaleidoscope Academic Conference Proceedings 2024
P. 414
2024 ITU Kaleidoscope Academic Conference
made towards throughput optimization as well. In [9], the exceed the threshold value, which is denoted as PL max .
authors study two methodologies to determine the optimal
horizontal position for throughput maximization. One of the The UAVs in the swarm can move individually in the
methods is computationally complex but is more resilient horizontal direction, with minimum overlapping, achievable
while the other does not involve high complexity but is via a circular geometry. The number of UAVs deployed
less accurate. In [6] and [9], the authors discuss throughput in the swarm (i.e. s) should be such that any point in the
optimization, while power and coverage optimization are the area of interest should lie inside the coverage region of at
main focus of the papers [5], [7] and [8]. To the best of least one of the UAVs belonging to the swarm. An UAV’s
the authors knowledge, the joint optimization of all these position is characterized by its altitude and a user’s position
parameters has not been discussed in the previous literature. is characterized by its distance from the center of the cell.
Another key issue that needs further investigation is that
existing coverage maximization schemes focus on maximizing
the number of users within the UAV footprint, instead of
ensuring coverage to every user. A solution for these two
challenges form the basis of the proposed architecture, as
will be discussed later.
The application area that this work targets is improving
coverage in the low-coverage areas, which implies maximizing
throughput and minimizing latency. The proposed set-up can
serve a considerable user count in an energy-efficient manner.
Such a scheme has a positive impact on the terminal battery
Fig. 1. System Model
life as well. It is also assumed that every point inside the
region is having a minimum specified coverage availability.
B. Propagation Model
B. Paper Organization
As per the literary works, the air-to-ground (ATG) radio
The rest of the paper is organized as follows. Section II frequency (RF) wave propagation scenario can be divided
introduces the system model including the network architec- into two broad groups. These groups are determined by
ture being considered. We also characterize the path loss, the characterizing the statistical behavior of the RF waves
power and the latency of the system. Then, the optimization propagating between the UAV-based transmitter and a
problem is formulated in Section III. The next Section IV ground-based receiver. One of these groups corresponds
carries out the experimental results and argues the accuracy to the LoS communication between the aerial transmitter
and the robustness of the proposed framework. Finally, the and the ground receiver, wherein the RF signal does not
paper concludes in section VI. face reflection or diffraction phenomenon. The other group
conforms to the waves that get reflected, diffracted, and
II. SYSTEM MODEL
contain multi-path components due to the Non Line of Sight
A rural area with a sparse user density is taken into (NLoS) communication between the UAV transmitter and
consideration. Aerial BSs are deployed to expand the con- ground receiver, due to several terrestrial obstacles such as
nectivity in the considered coverage area. Low amplitiutde buildings and trees. The authors in [10], [11] study these
platforms (LAPs) (UAVs) are considered in this paper, due propagation groups in detail.
to their ability to support superior coverage. This section
describes the architecture and the system model, followed by The radio waves generated by the UAV operating as
the characterization of the path loss, power and latency of the the BS travel through an open space until it reaches the
network under consideration. ground (or targeted coverage area), exhibiting free space
propagation. Scattering, shadowing result in additional path
A. System Architecture
loss in the ATG channel. The excessive path loss has a
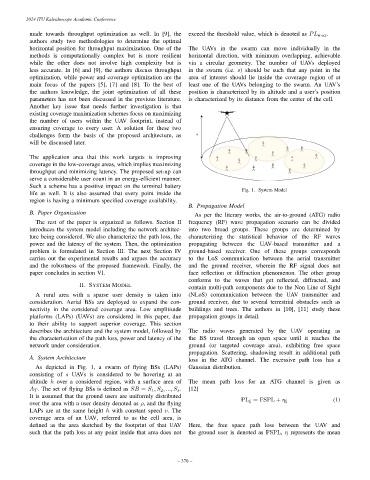
As depicted in Fig. 1, a swarm of flying BSs (LAPs) Gaussian distribution.
consisting of s UAVs is considered to be hovering at an
altitude h over a considered region, with a surface area of The mean path loss for an ATG channel is given as
A T . The set of flying BSs is defined as SB = S 1 , S 2 , ..., S s . [12]
It is assumed that the ground users are uniformly distributed
PL ξ = FSPL + η ξ (1)
over the area with a user density denoted as ρ, and the flying
LAPs are at the same height h with constant speed v. The
coverage area of an UAV, referred to as the cell area, is
defined as the area sketched by the footprint of that UAV Here, the free space path loss between the UAV and
such that the path loss at any point inside that area does not the ground user is denoted as FSPL, η represents the mean
– 370 –