
Page 409 - Kaleidoscope Academic Conference Proceedings 2024
P. 409
Innovation and Digital Transformation for a Sustainable World
--- (4)
Again
------- (5)
Here, y is represented as the output value for each training
phase. L.R. depends on the actual representation of the Figure 1: Normal ECG Figure 2: Anomalous ECG
data.
D) Decision Tree: In practical approaches, D.T. is the most Model Training: This phase uses a dataset consisting of
important predictive modelling and classification method. (4045 and 10505) where 4045 are normal ECG records, and
D.T. algorithm can help to detect different ways by splitting there are 10505 records for abnormal ECG signals. The
the data sets based on numerous situations. A responsive split of the data set into training and testing with a random
point value is treated as an actual set of values for any state is 1.
classification tree for a tree method-based model. The
purpose of the D.T. is to solve decision-making problems Here, 70% and 30% splitting ratios are used. During
that can be helpful in making building models more training checked the corresponding loss also. Below, figure
challenging. The steps for the decision tree are as follows 3 discusses the corresponding statistics of the model
training loss and corresponding validation loss. [27] .
a) it divides the data set into two sub-data.
b) the total trainig data is considered as a root for an initial
stage.
c) continuous values need to be classified before any model
building. However, in the case of categorical values,
preferences are given for detecting feature attributes.
d) in the case of any established subset, each subset
includes data that are useful for predicting future attributes. Figure 3: Model Training
e) At last, repetition of steps-(a) to steps(d) continues
unless we get a perfect leave. During the model construction, checked for the input,
In the case of D.T. classification, it started with reconstruction of signals and corresponding error level.
recording from the root level, where values get compared These are shown in below figures 4 and 5 with training loss
with root features for succeeding record characterization. In details.
this comparison, the equivalent values of the coming node
get successfully analyzed.
E) Approach of K-NN: KNN is another supervised ML
approach used for both regression and classification. For
categorization techniques, the use of k labels is allowed,
and for the regression, the returned value is the mean of k
labels. KNN is the basic technique used for classification
where earlier knowledge of data is missing. Manhattan
distance is used as a distance metric for distance units for
calculating the nearest data points. Knn gives better results Figure 4: Model Construction Figure 5: Model Loss
when data is large and noisy [26].
Next, we show the graph for training loss and test loss in
RESULTS AND DISCUSSION Figures 6 and 7
The proposed method uses a collected ECG data set of
patients suffering from arrhythmia diseases, and using ML
algorithms; there is a need to classify the ECG signal for
abnormality or normality. The collected input signals are
analyzed by using different filter methods like low pass and
high pass filters to check the level of noise present in the
signal. Detecting the peak present in the QRS area and Figure 6: Training Loss Figure 7: Test Loss
extracting the important characteristics for the ECG signal
helps to detect the presence of arrhythmia diseases. The The developed model shows the following statistics, which
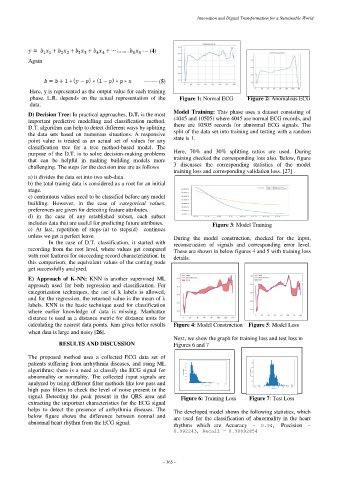
below figure shows the difference between normal and are used for the classification of abnormality in the heart
abnormal heart rhythm from the ECG signal.
rhythms which are Accuracy = 0.94, Precision =
0.992243, Recall = 0.90892854
– 365 –