
Page 88 - Kaleidoscope Academic Conference Proceedings 2022
P. 88
2022 ITU Kaleidoscope Academic Conference
Table 1 – Locational accuracy and latency Table 2 – Determination of threshold
Actual Estimated Distance Latency Slow Fast
location location deviation (ms) Threshold Walking Walking Running
(m) (30) (30) (30)
12.949037, 12.949024, 3.3 72
80.140572 80.140599 11.45 20.4 28.4 27.6
12.948213, 12.948214, 2.1 77 11.7 25.6 28.2 27.8
80.139994 80.140013
12.948849, 12.948865, 2.5 82 11.96 29.4 29 28
80.140914 80.140930
12.949498, 12.949510, 2 71 12.34 24 28.8 27.8
80.139833 80.139847
12.950599, 12.9506038, 1.8 68 12.59 20.6 26 27
80.140618 80.1406339 As observed in Table 3, the step count estimator in the
Average 2.34 74 proposed MAR-PNS model is well suited when the user is
walking as the error rate is 0.5% less than of the smart
4.2 SDE module watches. However, it is observed that it shows 2% more error
when the user is running. This model thus allows us to
In testing the step count module, we experimented the step estimate the relative position of the user with respect to the
count-based localization application by performing tests for turning point as soon as possible in the absence of GPS and
three scenarios, namely slow walking, fast walking and smoothens the navigation process. Using the results obtained
running. A threshold for acceleration was chosen (11 to 13) experimentally, the threshold value was set to 11.96 in the
based on a trial-and-error method for each experiment and SDE algorithm.
the user had to slow-walk, fast-walk and run for 30 steps five
times for each threshold. The average steps for each test case
are displayed in Table 2.
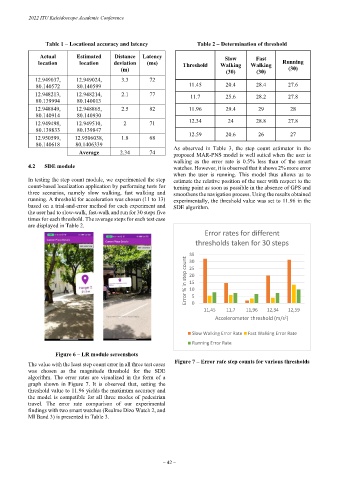
Error rates for different
thresholds taken for 30 steps
35
Error % in step count 25
30
20
15
10
5
0
11,45 11,7 11,96 12,34 12,59
2
Accelerometer threshold (m/s )
Slow Walking Error Rate Fast Walking Error Rate
Running Error Rate
Figure 6 – LR module screenshots
The value with the least step count error in all three test cases Figure 7 – Error rate step counts for various thresholds
was chosen as the magnitude threshold for the SDE
algorithm. The error rates are visualized in the form of a
graph shown in Figure 7. It is observed that, setting the
threshold value to 11.96 yields the maximum accuracy and
the model is compatible for all three modes of pedestrian
travel. The error rate comparison of our experimental
findings with two smart watches (Realme Dizo Watch 2, and
MI Band 3) is presented in Table 3.
– 42 –