
Page 889 - Shaping smarter and more sustainable cities - Striving for sustainable development goals
P. 889
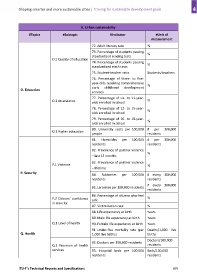
II. Urban sustainability
                   #Topics             #Subtopic                    #Indicator                 #Unit of
                                                                                            measurement

                                                         72. Adult literacy rate          %
                                                         73. Percentage of students passing
                                                         standardized reading tests       %
                                 O.1 Quality of education
                                                         74. Percentage of students passing
                                                                                          %
                                                         standardized math tests
                                                         75. Student‐teacher ratio        Students/teachers
                                                         76.  Percentage  of  three‐  to  five‐
                                                         year‐olds receiving comprehensive
                                                         early   childhood   development   %
              O. Education
                                                         services
                                                         77.  Percentage  of  six‐  to  11‐year‐
                                 O.2 Attendance          olds enrolled in school          %

                                                         78.  Percentage  of  12‐  to  15‐year‐
                                                         olds enrolled in school          %
                                                         79.  Percentage  of  16‐  to  18‐year‐  %
                                                         olds enrolled in school
                                                         80.  University  seats  per  100,000  #   per   100,000
                                 O.3 Higher education
                                                         people                           residents
                                                         81.   Homicides   per   100,000  #   per   100,000
                                                         residents                        residents
                                                         82. Prevalence of partner violence
                                                                                          %
                                                         – last 12 months
                                                         83. Prevalence of partner violence
                                 P.1 Violence                                             %
                                                         – lifetime
              P. Security
                                                         84.   Robberies   per   100,000  #  every  100,000
                                                         residents                        residents
                                                                                          #  every  100,000
                                                         85. Larcenies per 100,000 residents
                                                                                          residents
                                                         86. Percentage of citizens who feel
                                 P.2  Citizens'  confidence                               %
                                                         safe
                                 in security
                                                         87. Victimization rate           %
                                                         88. Life expectancy at birth     Years
                                                         89. Male life expectancy at birth   Years
                                 Q.1 Level of health     90. Female life expectancy at birth   Years

                                                         91  Under‐five  mortality  rate  (per  Deaths/1,000  live
              Q. Health                                  1,000 live births)               births

                                                                                          Doctors/100,000
                                                         92. Doctors per 100,000 residents
                                 Q.2  Provision  of  health                               residents
                                 services                93.  Hospital  beds  per  100,000  Beds/100,000
                                                         residents                        residents


            ITU‐T's Technical Reports and Specifications                                                  879