Page 888 - Shaping smarter and more sustainable cities - Striving for sustainable development goals
P. 888

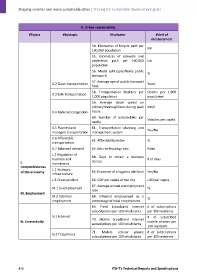
II. Urban sustainability
                   #Topics             #Subtopic                    #Indicator                 #Unit of
                                                                                            measurement

                                                         54. Kilometres of bicycle path per
                                                         100,000 population               km
                                                         55.  Kilometres  of  sidewalk  and
                                                         pedestrian  path  per  100,000  km
                                                         population
                                                         56. Modal split  (specifically public
                                                                                          %
                                                         transport)
                                                         57. Average age of public transport
                                 K.2 Clean transportation                                 Years
                                                         fleet
                                                         58.  Transportation  fatalities  per  Deaths  per  1,000
                                 K.3 Safe transportation
                                                         1,000 population                 population
                                                         59.  Average  travel  speed  on
                                                         primary thoroughfares during peak  km/h
                                 K.4 Reduced congestion   hours
                                                         60.  Number  of  automobiles  per
                                                         capita                           Vehicles per capita
                                 K.5 Planned and         61.  Transportation  planning  and
                                                                                          Yes/No
                                 managed transportation  management system
                                 K.6 Affordable          62. Affordability index          %
                                 transportation
                                 K.7 Balanced demand     63. Jobs‐to‐housing ratio        Ratio

                                 L.1 Regulation of
                                 business and            64.  Days  to  obtain  a  business   # of days
              L.                 investment              licence
              Competitiveness
                                 L.2 Strategic
              of the economy                             65. Existence of a logistics platform  Yes/No
                                 infrastructure
                                 L.3 Gross product       66. GDP per capita of the city   USD per capita
                                                         67. Average annual unemployment
                                 M.1 Unemployment                                         %
                                                         rate
              M. Employment
                                 M.2 Informal            68.  Informal  employment  as  a   %
                                 employment              percentage of total employment
                                                         69.  Fixed  broadband  Internet  #  of  subscriptions
                                                         subscriptions per 100 inhabitants   per 100 residents
                                 N.1 Internet                                             #  of  subscribed
                                                         70.  Mobile  broadband  Internet
              N. Connectivity                                                             mobile  phones per
                                                         subscriptions per 100 inhabitants
                                                                                          100 residents
                                                         71.   Mobile   cellular   phone  #  of  subscriptions
                                 N.2 Telephones
                                                         subscriptions per 100 inhabitants   per 100 residents


            878                                                      ITU‐T's Technical Reports and Specifications
   883   884   885   886   887   888   889   890   891   892   893