Page 885 - Shaping smarter and more sustainable cities - Striving for sustainable development goals
P. 885

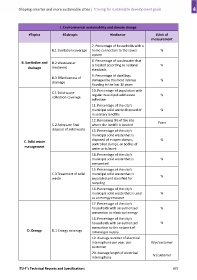
I. Environmental sustainability and climate change
                  #Topics              #Subtopic                    #Indicator                 #Unit of
                                                                                             measurement

                                                         7. Percentage of households with a
                                 B.1 Sanitation coverage   home connection to the sewer           %
                                                         system
                                                         8. Percentage of wastewater that
              B. Sanitation and   B.2 Wastewater         is treated according to national         %
                  drainage       treatment
                                                         standards
                                                         9. Percentage of dwellings
                                 B.3 Effectiveness of
                                                         damaged by the most intense              %
                                 drainage
                                                         flooding in the last 10 years
                                                         10. Percentage of population with
                                 C.1 Solid waste
                                 collection coverage     regular municipal solid waste            %
                                                         collection
                                                         11. Percentage of the city's
                                                         municipal solid waste disposed of        %
                                                         in sanitary landfills

                                                         12. Remaining life of the site
                                 C.2 Adequate final      where the landfill is located          Years
                                 disposal of solid waste   13. Percentage of the city's
                                                         municipal solid waste that is
                                                         disposed of in open dumps,               %
                C. Solid waste
                                                         controlled dumps, or bodies of
                management
                                                         water or is burnt
                                                         14. Percentage of the city's
                                                         municipal solid waste that is            %
                                                         composted
                                                         15. Percentage of the city's
                                 C.3 Treatment of solid   municipal solid waste that is           %
                                 waste                   separated and classified for
                                                         recycling
                                                         16. Percentage of the city's
                                                         municipal solid waste that is used       %
                                                         as an energy resource
                                                         17. Percentage of the city's
                                                         households with an authorized            %
                                                         connection to electrical energy

                                                         18. Percentage of the city's
                                                         households with an authorized            %
                                                         connection to the network of
                  D. Energy      D.1 Energy coverage
                                                         natural gas supply
                                                         19. Average number of electrical
                                                         interruptions per year, per        #/yr/customer
                                                         customer
                                                         20. Average length of electrical    hr/customer
                                                         interruptions


            ITU‐T's Technical Reports and Specifications                                                  875
   880   881   882   883   884   885   886   887   888   889   890