
Page 887 - Shaping smarter and more sustainable cities - Striving for sustainable development goals
P. 887
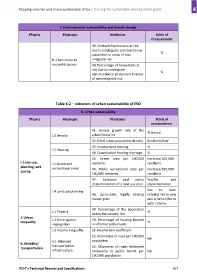
I. Environmental sustainability and climate change
                  #Topics              #Subtopic                    #Indicator                 #Unit of
                                                                                             measurement

                                                         39. Critical infrastructure at risk
                                                         due to inadequate construction or        %
                                                         placement in areas of non‐
                                 H.2 Sensitivity to      mitigable risk
                                 natural disasters       40. Percentage of households at
                                                         risk due to inadequate                   %
                                                         construction or placement in areas
                                                         of non‐mitigable risk


                                   Table K.2 – indicators of urban sustainability of ESCI


                                                  II. Urban sustainability
                   #Topics             #Subtopic                    #Indicator                 #Unit of
                                                                                            measurement
                                                         41.  Annual  growth  rate  of  the
                                                                                          % annual
                                 I.1 Density             urban footprint
                                                                                                      2
                                                         42. (Net) urban population density  Residents/km
                                                         43. Substandard housing          %
                                 I.2 Housing
                                                         44. Quantitative housing shortage   %
                                                         45.  Green  area  per  100,000  hectares/100,000
              I. Land use,       I.3 Green and           residents                        residents
              planning, and      recreational areas
              zoning                                     46.  Public  recreational  area  per  hectares/100,000
                                                         100,000 residents                residents
                                                         47.   Existence   and     active  Yes/No       and
                                                         implementation of a land use plan   implementation

                                                                                          Yes    to    both
                                 I.4 Land use planning
                                                         48.  Up‐to‐date,  legally  binding  criteria/ Yes to only
                                                         master plan                      one criterion/No to
                                                                                          both criteria
                                                         49.  Percentage  of  the  population
                                 J.1 Poverty                                              %
                                                         below the poverty line
              J. Urban
                                 J.2 Socio‐spatial       50. Percentage of housing located
              inequality                                                                  %
                                 segregation             in informal settlements
                                 J.3 Income inequality   51. Income Gini coefficient
                                                         52. Kilometres of road per 100,000
                                                                                          km
                                 K.1 Balanced            population
              K. Mobility/       transportation
              transportation                             53. Kilometres of roads dedicated
                                 infrastructure          exclusively  to  public  transit  per  km
                                                         100,000 population


            ITU‐T's Technical Reports and Specifications                                                  877