
Page 319 - Kaleidoscope Academic Conference Proceedings 2024
P. 319
Innovation and Digital Transformation for a Sustainable World
Figure 3 – Simulation Model of the Proped PDFA in
OptiSystem ®
is fed into the bit-error-rate (BER) analyzer.
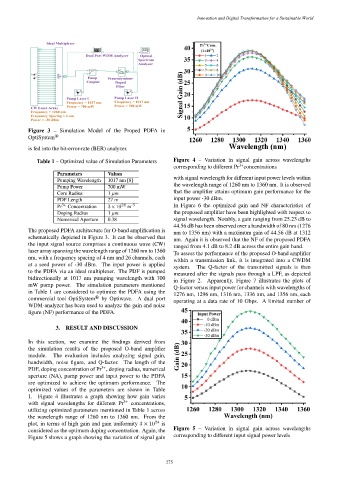
Table 1 – Optimized value of Simulation Parameters Figure 4 – Variation in signal gain across wavelengths
3+
corresponding to different Pr concentrations
Parameters Values
with signal wavelength for different input power levels within
Pumping Wavelength 1017 nm [8]
the wavelength range of 1260 nm to 1360 nm. It is observed
Pump Power 700 mW
that the amplifier attains optimum gain performance for the
Core Radius 1
PDF Length 27 m input power -30 dBm.
Pr 3+ Concentration 3 × 10 24 m -3 In Figure 6 the optimized gain and NF characteristics of
Doping Radius 1 the proposed amplifier have been highlighted with respect to
Numerical Aperture 0.38 signal wavelength. Notably, a gain ranging from 25.23 dB to
44.56 dB has been observed over a bandwidth of 80 nm (1276
The proposed PDFA architecture for O-band amplification is
nm to 1356 nm) with a maximum gain of 44.56 dB at 1312
schematically depicted in Figure 3. It can be observed that
nm. Again it is observed that the NF of the proposed PDFA
the input signal source comprises a continuous wave (CW)
ranged from 4.1 dB to 8.2 dB across the entire gain band.
laser array spanning the wavelength range of 1260 nm to 1360
To assess the performance of the proposed O-band amplifier
nm, with a frequency spacing of 4 nm and 26 channels, each
within a transmission link, it is integrated into a CWDM
at a seed power of -30 dBm. The input power is applied
system. The Q-factor of the transmitted signals is then
to the PDFA via an ideal multiplexer. The PDF is pumped
measured after the signals pass through a LPF, as depicted
bidirectionally at 1017 nm pumping wavelength with 700
in Figure 2. Apparently, Figure 7 illustrates the plots of
mW pump power. The simulation parameters mentioned
Q-factor versus input power for channels with wavelengths of
in Table 1 are considered to optimize the PDFA using the
1276 nm, 1296 nm, 1316 nm, 1336 nm, and 1356 nm, each
commercial tool OptiSystem ® by Optiwave. A dual port
operating at a data rate of 10 Gbps. A limited number of
WDM-analyzer has been used to analyze the gain and noise
figure (NF) performance of the PDFA.
3. RESULT AND DISCUSSION
In this section, we examine the findings derived from
the simulation results of the proposed O-band amplifier
module. The evaluation includes analyzing signal gain,
bandwidth, noise figure, and Q-factor. The length of the
3+
PDF, doping concentration of Pr , doping radius, numerical
aperture (NA), pump power and input power to the PDFA
are optimized to achieve the optimum performance. The
optimized values of the parameters are shown in Table
1. Figure 4 illustrates a graph showing how gain varies
with signal wavelengths for different Pr 3+ concentrations,
utilizing optimized parameters mentioned in Table 1 across
the wavelength range of 1260 nm to 1360 nm. From the
plot, in terms of high gain and gain uniformity 3 × 10 24 is
considered as the optimum doping concentration. Again, the Figure 5 – Variation in signal gain across wavelengths
Figure 5 shows a graph showing the variation of signal gain corresponding to different input signal power levels
– 275 –