
Page 320 - Kaleidoscope Academic Conference Proceedings 2024
P. 320
2024 ITU Kaleidoscope Academic Conference
Table 2 – Comparison of Pr 3+ doped O-band optical amplifiers
Authors Input Gain BW G max NF Performance Evaluation
Power Range (dB) (nm) (dB) Range (dB) in Optical Trasmission
(dBm) Link
Nishida et al. [8] -30 10-23 1280-1330 23 - No
Mirza et al. [7] -30 - 1250-1350 22.7 4-10 No
Alharbi et al. [9] -30 24-56.4 1270-1350 56.4 5.8-11.5 No
Present Work -30 25.23-44.56 1276-1356 44.56 4.1-8.2 Yes
Figure 6 – Optimized performance of signal gain and noise Figure 8 – Quality factor (Q-Factor) as a function of fiber
figure across different wavelengths length for five different channels wavelength
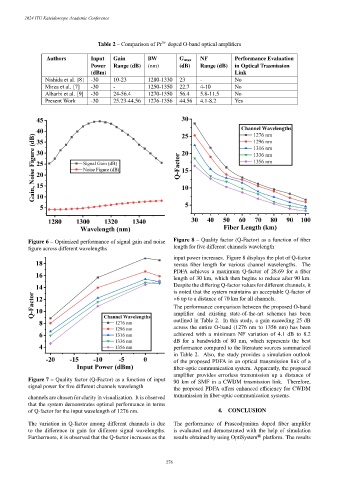
input power increases. Figure 8 displays the plot of Q-factor
versus fiber length for various channel wavelengths. The
PDFA achieves a maximum Q-factor of 28.69 for a fiber
length of 30 km, which then begins to reduce after 90 km.
Despite the differing Q-factor values for different channels, it
is noted that the system maintains an acceptable Q-factor of
>6 up to a distance of 70 km for all channels.
The performance comparison between the proposed O-band
amplifier and existing state-of-the-art schemes has been
outlined in Table 2. In this study, a gain exceeding 25 dB
across the entire O-band (1276 nm to 1356 nm) has been
achieved with a minimum NF variation of 4.1 dB to 8.2
dB for a bandwidth of 80 nm, which represents the best
performance compared to the literature sources summarized
in Table 2. Also, the study provides a simulation outlook
of the proposed PDFA in an optical transmission link of a
fiber-optic communication system. Apparently, the proposed
amplifier provides errorless transmission up a distance of
Figure 7 – Quality factor (Q-Factor) as a function of input
90 km of SMF in a CWDM trnsmission link. Therefore,
signal power for five different channels wavelength
the proposed PDFA offers enhanced efficiency for CWDM
channels are chosen for clarity in visualization. It is observed transmission in fiber-optic communication systems.
that the system demonstrates optimal performance in terms
of Q-factor for the input wavelength of 1276 nm. 4. CONCLUSION
The variation in Q-factor among different channels is due The performance of Praseodymium doped fiber amplifer
to the difference in gain for different signal wavelengths. is evaluated and demonstrated with the help of simulation
®
Furthermore, it is observed that the Q-factor increases as the results obtained by using OptiSystem platform. The results
– 276 –