C.3 Project design
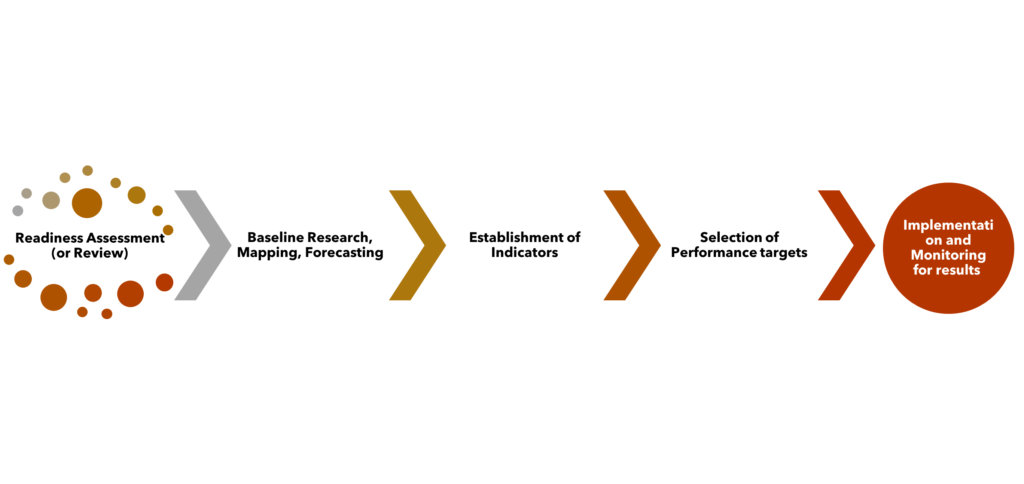
C.3.1 Readiness assessment
The first step in developing a project involves a readiness assessment. At this stage, the implementing agency, which in this section is assumed to be the fund, will review its institutional arrangements and confirm that the political commitment, incentives and capacity are in place to execute the project in a manner that can be evaluated effectively. In many ways, this means planning the project with the end in mind. This step will facilitate results-based monitoring and evaluation (M&E), which is an important public management tool that facilitates the demonstration of accountability, transparency and results to stakeholders.
Checklist: Readiness
✅ Overarching policy, strategy, agenda in place (e.g. national development plan, digital agenda, universal services and access (UAS) strategy, donor/partner policy, or others)?
✅ Have the champions for the UAS strategy implementation and therefore for building and using an monitoring and evaluation (M&E) system been identified? They may be from government, parliament, civil society, donors, and others.
✅ What is motivating those who champion building an M&E system—a political reform agenda, pressures from donors?
✅ Have M&E managers within the institution been identified and trained?
✅ Have M&E tools been agreed, and has training been provided?
✅ Is M&E budgeted?
✅ Does the monitoring system have clear ownership, management, maintenance and credibility?
✅ Data collection standards and evaluation methodologies have been agreed and include assurance that data collection will be reliable, valid, credible, and timely.
Source: adapted from World Bank
Download checklistC.3.2 Baseline research, mapping and forecasting
A foundational step for any UAS intervention is a clear and evidence-based definition of the problem. It is insufficient to argue that there a problem or gap that needs to be funded if that gap has not been quantified. There is a need for policy-makers, regulators, USAFs and other financiers to base their funding decisions on clear empirical research, which will:
- enable the proper identification of the challenge (i.e. the gap);
- facilitate targeted investment through the identification of appropriate solutions;
- provide the information to enable the accurate evaluation of impact and outcomes of the investment.
This is done through (i) mapping connectivity and access, (ii) baseline research and base case research and (iii) the mapping of funding actors – all of which are described in this section. This section also provides guidance on how these activities can be conducted and case studies to support the guidance.
Baseline report
Informed by a wide range of quantitative, qualitative and trend indicators, a baseline report presents the economic, social, infrastructural and environmental position at the outset of the project. This is the information that the government, regulator or fund has about a situation before making a decision to act. In can include information such as levels of connectivity, levels of adoption and usage, extent of community engagement, availability of and access to training, availability of online information in local languages, and other indicators that may not be readily available without focussed research.
| Access gap study as a form of baseline research A common form of baseline research involves market gap analysis or an access gap study, which have been used to support universal access and service strategies for decades. Access gap studies tend to have a geographical or infrastructure bias in that the gap analysis model has as its premise that there are various geographical ‘zones’ in a country that need to be covered. The market efficiency, smart-subsidy and true access gaps, which exist and represent areas beyond which commercially motivated roll-out is unlikely. Each of the zones required different strategies and funding models in order to be addressed and ultimately closed. Market gap analysis remains an important and complementary tool to determine where the private sector is likely to invest and to design subsidisation models. |
Baseline reports should incorporate information obtained through an access gap study but should go beyond that. A baseline report should also:
- assess the broader socio-economic impacts of digitalization;
- include information on the policy, regulatory and fiscal environment, the status of digital skills, gender, age and education;
- address pricing and affordability of services and handsets;
- discuss the state of adoption or take-up; and
- discuss the state of coverage and access and in so doing provide detail on Internet quality and speed. This aspect is important to understand in as much detail as possible – hence the recommendation to map connectivity and access as a complementary tool to the baseline research.
Quantitative and qualitative research are needed to complement the basic information that is gathered to support a baseline report. The common market research approaches and tools that are used for the baseline study are similar to those used during the monitoring and evaluation stage. They include:
- desktop research and a systematic review of relevant official statistics;
- case studies;
- structured questionnaires;
- focus groups;
- surveys;
- one-on-one interviews.
Case studies: Access gap studies and baseline reports
Kenya: Access gap study (2016) The study on ICT access gaps in Kenya had two main components: Phase 1: The access gaps study is aimed at conducting a country level assessment to determine the extent of communication coverage and the access levels by citizens in the telecommunication, post and courier, and broadcasting sectors, and the gaps in infrastructure and service coverage across all sub-locations in Kenya. Phase 2: Design an initial set of priorities for universal service fund (USF) projects in the voice and broadband basic telecommunication sectors and support the authority in managing competitive tendering of the network expansion projects in Year 1. See: https://www.ca.go.ke/wp-content/uploads/2018/02/ICT-Access-Gaps-Report-April-2016-.pdf
Guyana: National ICT needs assessment consultancy baseline report This baseline report describes the state (high-level) of the ICT situation in Guyana that focuses on the hinterland, poor and remote areas. The baseline report and needs analysis informed projects to be undertaken by the Guyana REDD + Investment Fund (GRIF) and looked at Guyana’s economy, education, health and business sectors; and provided an as-is analysis of technical infrastructure and regulation. It was complemented by (1) a technical report that looked at a technology assessment, design options for Guyana, commercial assessment of solutions, proposed Guyana solution, roll-out phases, stakeholder analysis, business models, implication for legislation and policy development, implementation plan, and (2) an e-services readiness assessment report highlighting important service needs, status quo of e-services readiness, vision of e-services offered by government agencies, description of selected e-services, implementation roadmap and cost approximation, key success factors for e-government service implementation. See report here.
Connectivity and access maps
ITU Broadband Maps
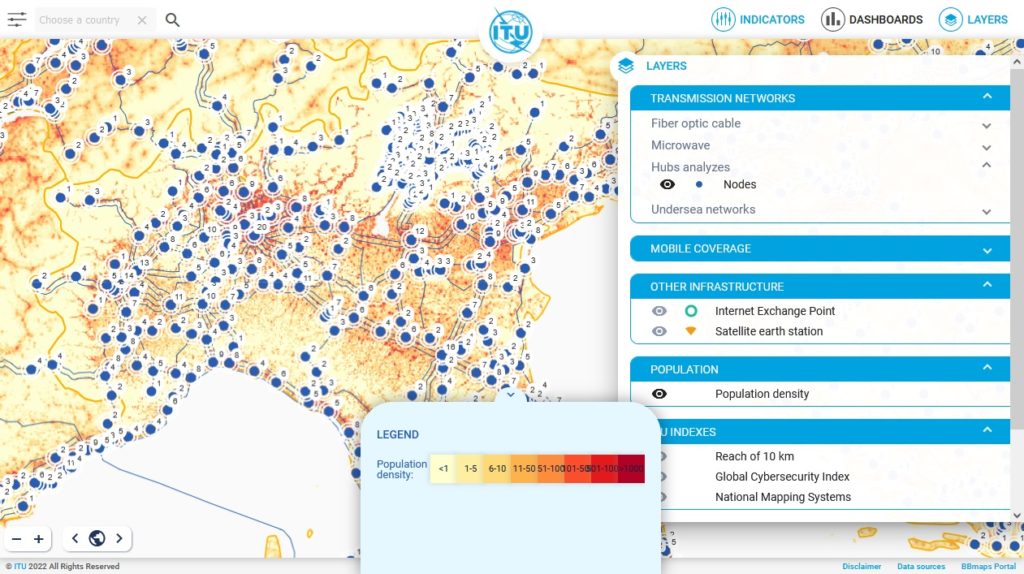
The ITU broadband maps platform takes stock of networks at national, regional and on global levels. The maps show in detail the location of fibre-optic cables, microwave links, submarine cables, satellite earth stations, Internet exchange points (IXPs), and mobile coverage Other key metrics of the ICT sector and GIS analysis are available, such as geographical analysis of population within a node (access point to big optical-fibre). The maps pinpoint where communication links are and areas where they are lacking. Understanding ICT infrastructure on the ground allows policy-makers, regulators, industry, development institutions, and network planners to assess market opportunity to close connectivity gaps, particularly in developing countries.
See:
- ITU broadband maps: https://www.itu.int/en/ITU-D/Technology/Pages/InteractiveTransmissionMaps.aspx
- ICT infrastructure map: https://bbmaps.itu.int/bbmaps/
- ICT infrastructure and financial inclusion map guide: https://www.youtube. com/watch?v=G4pqfudoXaw
- Mapping ICT infrastructure and financial inclusion in Mexico https://sway.office.com/ OMeV6wQtoc2Bi6TG?ref=Link
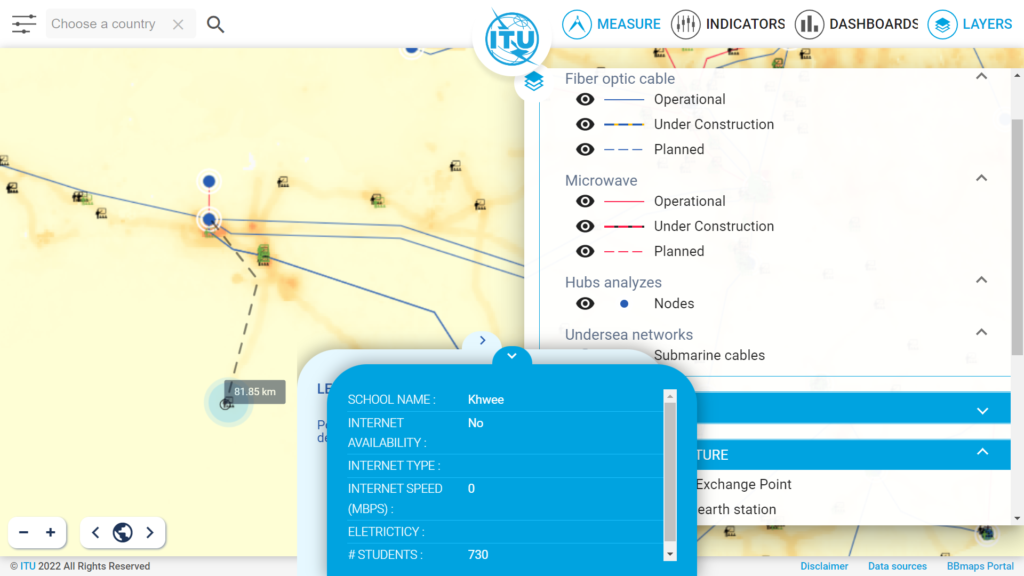
Mapping provides an important visual representation of the status of connectivity. Using a solid ICT infrastructure base with network information relating to the location of fibre-optic cables, microwave links, submarine cables, base stations, towers, Internet exchange points and other key infrastructure locations is key to present the status of the existing infrastructure and to support the mapping of the investment (funding) required. Given GIS technology, this can be obtained in real-time making it possible to measure gaps more accurately. This information can be overlayed on other data sets with data relating to other types of infrastructure such as electricity and transport infrastructure. This can be overlayed against population, income, education facilities (schools, see ITU-UNICEF Giga initiative https://gigaconnect.org), libraries, medical facilities (hospitals, clinics) and other key economic and social data.
With improved technology, it is now possible to obtain real-time data on connectivity that, coupled with baseline research, is a prerequisite for policy-makers, regulators and fund administrators to determine needs.
Why map?
GIS mapping is an important decision-making tool which is data-driven, and importantly includes spatial data. This has significant implications for public policy and in particular for UAS policy and strategy given that UAS networks are often geographically driven, and better understood visually. UAS maps can be made more meaningful if they address:
- What the “problem” is-
- Where are the people?
- Where are the networks?
- What are the gaps and what do they have in common?
- What are multiple players doing? (At service, infrastructure, finance levels)
- Where should resources be applied?
- What kind of interventions make sense and will have an impact?
Mapping is an important in that it can be understood commonly by many stakeholders making it easier to:
- Get attention/call to action.
- Measure progress- the mas should not be static.
- Share information.
Base case and forecasts
Scenario analysis is a process of examining and evaluating possible events or scenarios that could take place in the future and predicting the various feasible results or possible outcomes. In a business context, i.e. in financial modelling, the process is typically used to estimate changes in the value of a business or cash flow, especially when there are potentially favourable and unfavourable events that could occur. The same can be applied in a policy and market context.
If the baseline and maps present an “as is” situation, the base case provides a “possible in future” model. Using mapping and baseline research as the starting point, the base case (or “reference case”) represents what is expected to happen in the future if no intervention is made. In a universal access context, the base case provides a forecast that requires an informed judgement on the social, environmental and economic trends that would occur over the period, assuming no intervention is made. The forecast can be better than the baseline (best case scenario), or worse (worst case scenario), depending on what trends are projected.
How to get to a base case
✅ Define key assumptions (e.g. network roll-out, costs, and pricing).
✅ Define potential scenarios (e.g. increased competition, new technologies).
✅ Forecast the likely changes in economic, social, infrastructure and environmental variables.
✅ Identify the type of intervention being considered.
✅ Input the historical or benchmark information in the area or comparable areas.
✅ Consider and scenario plan the level of market failure in the area concerned.
✅ Consider and scenario plan the impact of regulatory and policy decisions.
✅ Consider and scenario plan impact of existing and planned investment (public and private).
Download checklistDealing with information gaps
In an ideal world, at inception, all UAS programmes will have been informed by baseline research and mapping. However, often, given the importance of UAS and the social and political implications of the absence of connectivity and access, decisions are made to close perceived gaps and make interventions based on intuition. Often these judgement calls, informed by local experience and public opinions are helpful in identifying a challenge, however in the absence of evidence, they risk coming up with the wrong solutions. The lack of an evidence-based approach often leads to inappropriate policy and funding interventions, over or underspending on projects, and an approach that is not holistic and therefore does not truly address the problem or close the gap. There are several reasons for lack of upfront baseline data:
- A force majeure or other disaster may not have made it possible to determine baseline conditions before implementation begins – for example in the case of the COVID-19 pandemic and interventions to connect businesses for e-commerce or to connect schools for online learning, there may not have been data on school connectivity prepared.
- There may not have been an understating by the policy-makers of the research requirements that are key to the project.
- There may not have been funding for detailed research before a project is conceptualised. This is an important issue – it is key that the baseline study should form part of the budget for the funding of project activities.
While the non-existence of baseline data and a needs analysis is not ideal, there are ways to try to reconstruct it. This can be done using:
- Secondary data, such as national studies and reports on the costs of communications in a region or country. Ministries of education, health and agriculture, among others, publish annual reports that can be analysed to provide baseline reference data. In strategic institution contexts, they can sometimes provide information on particular schools, hospitals or police stations.
- National level data such as census information, household survey data, or sector specific survey data from government agencies, which may include ICT-related indicators.
Risks of following your instincts instead of using evidence
• Policy mismatch – unintended policy outcomes, reduced impact
• Funding mismatch – not meeting social, economic or financial return expectations
• Partnership mismatch – not meeting social, economic or financial return expectations
• Wrong solution – wrong funding model, waste of money!
C.3.3 Establishment of indicators
It is very difficult to measure the impact of the project and of the funding that has been deployed if there is no objective and evidence-based understanding of what the situation was when it began. Importantly, baseline data, mapping and forecasting must be relevant to the indicators that have been identified in the planning phase and will be used later to measure impact. Thus, the selection and use of universally accepted and relevant indicators is a key component of this step in which baseline and forecast data is captured.
Good practice examples of indicators matched with funding priorities
The following are examples. They may or may not suit your needs but should give an idea of the kind of indicators you can use, especially for measuring impact. Where possible data gathered from national statistics offices, household surveys, and other government sources should be aligned to these global standards.
| Global SDG indicator framework [1] | Economic development indicators [2] |
| The global indicator framework includes 231 unique indicators and includes 7 ICT indicators covering 6 targets under Goals 4, 5, 9, and 17. They include: Indicator 4.4.1: Proportion of youth and adults with ICT skills, by type of skillsIndicator 5.b.1: Proportion of individuals who own a mobile telephone, by sexIndicator 9.c.1: Proportion of population covered by a mobile network, by technologyIndicator 17.6.1: Fixed and mobile Internet broadband subscriptions per 100 inhabitants, by speedIndicator 17.8.1: Proportion of individuals using the Internet See also SDG Impact Indicators: A Guide for Investors and Companies | Macroeconomic performance – gross domestic product (GDP), GDP per capita, Gross National Income (GNI), consumption, investment, and international tradeMeasures of stability- central government budgets, prices, the money supply, and the balance of paymentsMeasures of income and savings adjusted for pollution, depreciation, and depletion of resources |
Connectivity | Innovation, R&D |
| ICT indicators [3] Fixed-telephone network indicatorsMobile-cellular network indicatorsInternet, traffic and bundled services indicatorsQuality of service (QoS) indicators Investment indicators[4] Telecoms infrastructure investment Also see ESG Social Indicators See also ITU Handbook for the Collection of Administrative Data on Telecommunications/ICT (2020) | Investment indicators[5] Employment in the ICT sector and subsectorsTelecommunication services revenueValue added of ICT sector and sub-sectorsICT and total business expenditure of R&D intensitiesSpecialisation in R&D related patentsICT goods and service exports, by economy or region of value-added originChanges in wages relative to labour productivityICT investment by capital asset, as a percentage of GDPEvolution of ICT investments, as a percentage of total investments |
Adoption | Inclusion |
| ICT indicators (adoption)[6] [7] Market penetrationSIMs per subscriberICT prices indicators.Quality of service (QoS) indicatorsAverage revenue per user | Development indicators Number of community organisations in the area/projectNumber of youth groups in the area/project Women with access to broadbandYouth with access to broadbandPersons with disabilities with access to broadbandStructure of political leadership in project area, by age and gender |
ESG indicators | |
| Environmental impact indicators Social indicators Governance indicators |
ESG indicators
ESG performance indicators are important to ensure compliance with relevant and material issues from an environmental, social and governance perspective (ESG) – in many ways these issues facilitate the meeting of the very goals that the SDGs espouse. The absence of proper ESG monitoring could also have an impact on projects costs and could result in project delays, depending on the issues. Thus, factoring in ESG to investment, especially by commercial and development funds, marries financial support with values, viability and sustainability. ESG considerations have arguably always informed the good practice principles of funds, however they have not been explicitly factored into USAF financing or measured.
Specifically measuring ESG is a good practice that funds should adopt as it provides further tools to make sure that the projects they support are sustainable, and that they do not have a negative developmental impact – whether it is the effect of equipment on climate change, technology on health, employment on diversity and inclusion, or any other matter. ESG compliance helps to identify and seeks to mitigate risks related to governance such as political interference and employment. Considering ESG results in better and more sustainable projects. Key ESG characteristics from an ICT and digital technology specific perspective include:
- Environmental: Issues around potential health concerns, including exposure to electromagnetic frequency (EMF) radiation from telecommunication equipment and devices, e-waste, pollution, and the impact of ICTs on climate change and energy efficiency, have cost, risk and environmental implications that are measured as part of ESG compliance. Safe disposal of devices, packaging and batteries is also an important environmental challenge faced by the sector. Climate change and energy efficiency are increasingly important to the ICT sector given the role of energy in the value chain, from base stations to data centres, as well as its role in facilitating normal business operations. Green projects are increasingly more attractive for funding, in fact green bonds which are financial instruments that support investments and projects that have a positive benefit on the environment, are designed to address these and other ESG risks. Unique to the sector is the consideration that different technologies have different impacts and could influence funding decisions. Fibre-to-the-home (FTTH), for example, is reportedly about 85 per cent more energy-efficient than older copper networks given that it reduces the need for cooling systems and the number of central offices.
- Social: Given the pervasiveness of the digital economy, the impact of ICTs and digitalization are highly visible and felt almost immediately by a broad spectrum of consumers and end users. The impact of ICTs on persons with disabilities and specific needs, older persons and other vulnerable groups of persons, including women and children must be measured. In addition, social media and data usage risks and effects need to be managed; as well as ‘social’ considerations related to the ICT operations such as labour issues and data security incidents.
- Governance: Governance risks and impacts are not unique to the ICT and digital space. They are felt in all sectors and tend to be country, region and even company specific given that governance risks are influenced by political, regulatory and legal climates. In a highly regulated sector such as the ICT sector, governance standards, risks and mitigations vary based on the nature of processes underway such as licensing processes, auctions and other regulatory decisions. Specific to UAS, issues such as coverage and roll-out obligations and other universal service obligations have implications on investment decisions and may be measured under “governance” or “social”.
Many funding institutions will provide an ESG matrix along with their finance, which requires information in addition to standard financial disclosure. The templates below reflect the metrics considered by various development and private financiers. Similarly, USAF 2.0 should include relevant ESG measures and metrics in its funding and reporting frameworks. It should be noted that the ESG field is vast and varied and the data requested should be directly linked to the information evaluated by the USAF.
ESG performance indicators (sample)

ESG reference material and good practice standards
| Commonwealth Development Corporation (CDC) ESG Toolkit for Financial Institutions CDC ESG Toolkit for Fund Managers | |
IFC Performance Standards (in particular on labour, resource efficiency, community) | |
World Bank Group Environmental Health and Safety (EHS) Standards: (1) World Bank General EHS Guidelines and (2) World Bank EHS Guidelines for Telecommunications | |
GSMA: How Telcos can Unlock New Value Through Total Societal Impact (March 2021) |
C.3.4. Project summary and selection of performance targets
Project summary
Once the project has been clearly defined it should be summarised using the project summary template below for all partners and beneficiaries. This serves to record and clearly describe key aspects of the project.
The objective is to ensure that the data and inputs can be used in future phases including the request for proposals, monitoring and evaluation, and reporting phases.
Project summary template
| Project title | <Insert> | |
| Goal | <Insert> | |
| Target/s | <Insert> | |
| Commencement date | <Insert> | |
| Duration | <Insert> | |
| Beneficiaries | <Insert> | |
| Indicators | <Insert> | |
| Cost | <Insert> | |
| Secured funding / budget | <Insert> | |
| Funding source/s | <Insert> | |
| Partners | <Insert> |
Selecting performance targets
Once the project is clearly set out in the project summary template for all stakeholders, target setting is the final step in building the performance framework based on outcomes, indicators, and baselines.
A big challenge is how to integrate monitoring and evaluation (M&E) into the project planning and the role that M&E plays in the design phase of the project. There are some well-known ICT connectivity project methods such as Outcome Mapping (bottom up), and the Logical Framework Analysis (top down), both of which include the need to identify and include key stakeholders, well-defined outputs, and M&E.[1]

Regardless of approach, targets must be quantifiable, and must use indicators that are time sensitive. Long-term targets such as the SDGs are often included in national policies and agendas and tend to be globally and politically driven. These goals act as a guide to short- to medium-term targets that are achievable at local and national levels.

Example of a universal service fund implementation strategy

[1] SDG Indicators: https://unstats.un.org/sdgs/indicators/indicators-list/. These are listed by goal https://irp-cdn.multiscreensite.com/be6d1d56/files/uploaded/150612-FINAL-SDSN-Indicator-Report-Table-1.pdf
[2] See: https://databank.worldbank.org/source/world-development-indicators
[3] ITU Handbook for the Collection of Administrative Data on Telecommunications/ICT (2020): https://www.itu.int/en/ITU-D/Statistics/Documents/publications/handbook/2020/ITUHandbookTelecomAdminData 2020_E_rev1.pdf
[4] See OECD Key ICT Indicators https://www.oecd.org/digital/broadband/oecdkeyictindicators.htm
[5] See OECD Key ICT Indicators https://www.oecd.org/digital/broadband/oecdkeyictindicators.htm
[6] ITU Handbook for the Collection of Administrative Data on Telecommunications/ICT (2020): https://www.itu.int/ en/ITU-D/Statistics/Documents/publications/handbook/2020/ITUHandbookTelecomAdminData 2020_E_rev1.pdf
[7] GSMA Metrics and Indicators https://www.gsmaintelligence.com/data/?report=5d1bdf2780a98