
Page 232 - ITU Kaleidoscope 2016
P. 232
2016 ITU Kaleidoscope Academic Conference
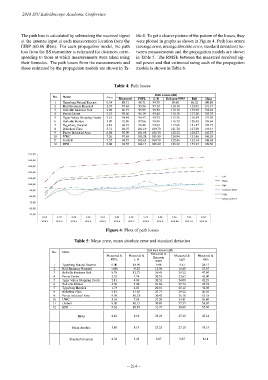
The path loss is calculated by subtracting the received signal ble 4. To get a clearer picture of the pattern of the losses, they
at the antenna input at each measurement location from the were plotted in graphs as shown in Figure 4. Path loss errors
EIRP (60.86 dBm). For each propagation model, the path (average error, average absolute error, standard deviation) be-
loss from the BS transmitter is estimated for distances corre- tween measurements and the propagation models are shown
sponding to those at which measurements were taken using in Table 5. The RMSE between the measured received sig-
their formulas. The path losses from the measurements and nal power and that estimated using each of the propagation
those estimated by the propagation models are shown in Ta- models is shown in Table 6.
Table 4: Path losses
Path Losses (dB)
No. Name d km
Measured FSPL L-R Ericsson 9999 Egli Hata
1 Tygerberg Natural Reserve 0.54 80.71 80.71 99.70 90.68 86.32 108.88
2 Harl Bremmer Hospital 2.37 97.62 93.56 97.10 110.18 112.01 131.17
3 Bellville Business Park 2.98 86.77 95.55 99.50 110.18 115.99 134.62
4 Parow Centre 3.21 93.66 96.19 95.40 114.18 117.28 135.75
5 Tyger Valley Shopping Centre 3.51 94.84 96.97 99.70 115.36 118.84 137.09
6 Bellville Market 3.89 92.90 97.86 98.80 116.72 120.62 138.64
7 Tygerberg Hospital 4.18 96.75 98.48 99.60 117.66 121.87 139.73
8 Bellefleur Flats 5.71 98.07 101.19 109.70 121.78 127.29 144.43
9 Parow Industrial Area 6.04 92.09 101.68 102.30 122.52 128.27 145.27
10 UWC 7.26 97.65 103.28 105.50 124.94 131.46 148.05
11 Unibell 7.55 94.57 103.62 104.70 125.46 132.14 148.64
12 HPR 8.04 94.55 104.17 105.40 126.29 133.23 149.58
Figure 4: Plots of path losses
Table 5: Mean error, mean absolute error and standard deviation
Path loss Errors (dB)
No. Name Measured &
Measured & Measured & Ericsson Measured & Measured &
FSPL L-R Egli Hata
9999
1 Tygerberg Natural Reserve 0.00 18.99 9.98 5.61 28.17
2 Harl Bremmer Hospital -4.06 -0.52 12.56 14.40 33.55
3 Bellville Business Park 8.78 12.73 26.43 29.22 47.86
4 Parow Centre 2.53 1.74 20.52 23.63 42.09
5 Tyger Valley Shopping Centre 2.13 4.86 20.52 24.00 42.25
6 Bellville Market 4.96 5.90 23.82 27.72 45.74
7 Tygerberg Hospital 1.74 2.85 20.91 25.12 42.98
8 Bellefleur Flats 3.12 11.63 23.71 29.22 46.36
9 Parow Industrial Area 9.59 10.21 30.43 36.18 53.18
10 UWC 5.63 7.85 27.29 33.81 50.40
11 Unibell 9.05 10.13 30.89 37.57 54.07
12 HPR 9.62 10.85 31.74 38.69 55.04
Mean 4.42 8.10 23.23 27.10 45.14
Mean absolute 5.10 8.19 23.23 27.10 45.14
Standard deviation 4.32 5.45 6.87 9.67 8.11
– 214 –