
Page 231 - ITU Kaleidoscope 2016
P. 231
ICTs for a Sustainable World
the BS transmitter antenna parameters such as pointing di- The assumed resultant effect of the return loss and the an-
rection, pattern and gain were unknown, which brings in a tenna gain of the Nagoya NA-773 wide band telescopic an-
degree of uncertainty about the real EIRP dissipated by the tenna was regarded as a correction factor (CF) to every mea-
transmitter in the direction where the measurements were surement. Using the FSPL equation 2, the FSPL at 0.54 Km
made. Therefore, we had to make the following assumptions distance and at the broadcasting frequency of 479.15 MHz
in order to be able to analyse the results further: was calculated as 80.71 dB, and the CF as 60.54 dB (As-
sumed EIRP - measurement at Site 1 + assumed FSPL at
1. The published ERP of the TV transmitter (63.01 dBm)
Site 1).
minus 2.15 dB is the EIRP dissipated in the direction
where the measurements were taken and attribute the P L = 32.45 + 20 ∗ log(f) + 20 ∗ log(d) (2)
difference between the received power at the antenna
where P L is the free space path loss in dB, f is the
input of the spectrum analyzer and the actual power
frequency in MHz and d is the distance in kilometers.
measured by the spectrum analyser at Site 1 as a re-
sultant effect of the return loss and the antenna gain of
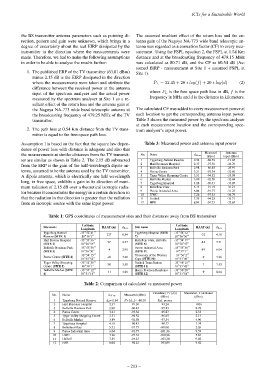
the Nagoya NA-773 wide band telescopic antenna at The calculated CF was added to every measurement power at
the broadcasting frequency of 479.25 MHz of the TV each location to get the corresponding antenna input power.
transmitter. Table 3 shows the measured power by the spectrum analyser
at each measurement location and the corresponding spec-
2. The path loss at 0.54 Km distance from the TV trans- trum analyser’s input power.
mitter is equal to the free-space path loss.
Assumption 1 is based on the fact that the square law depen- Table 3: Measured power and antenna input power
dence of power loss with distance is adequate and also that
Measured Antenna
the measurements at similar distances from the TV transmit- No. Name d Km
(dBm) input (dBm)
ter are similar as shown in Table 2. The 2.15 dB subtracted 1 Tygerberg Natural Reserve 0.54 -80.39 -19.85
2 Harl Bremmer Hospital 2.37 -97.30 -36.76
from the ERP is the gain of the half-wavelength dipole an-
3 Bellville Business Park 2.98 -86.45 -25.91
tenna, assumed to be the antenna used by the TV transmitter. 4 Parow Centre 3.21 -93.34 -32.80
A dipole antenna, which is electrically one half wavelength 5 Tyger Valley Shopping Centre 3.51 -94.52 -33.98
6 Bellville Market 3.89 -92.58 -32.04
long, in free space, exhibits a gain in its direction of maxi-
7 Tygerberg Hospital 4.18 -96.43 -35.89
mum radiation of 2.15 dB over a theoretical isotropic radia- 8 Bellefleur Flats 5.71 -97.75 -37.21
tor because it concentrates the energy in a certain direction so 9 Parow Industrial Area 6.04 -91.77 -31.23
10 UWC 7.26 -97.33 -36.79
that the radiation in that direction is greater than the radiation 11 Unibell 7.55 -94.25 -33.71
from an isotropic source with the same input power. 12 HPR 8.04 -94.23 -33.69
Table 1: GPS coordinates of measurement sites and their distances away from BS transmitter
Latitude Latitude
Site name HAAT (m) d km Site name HAAT (m) d km
Longitude Longitude
◦ 0 00 ◦ 0 00
Tygerberg Natural -33 52 41 Tygerberg Hospital (SITE -33 54 32
◦ 0 00 227 0.54 ◦ 0 00 -22 4.18
Reserve (SITE 1) 18 36 1 7) 18 36 56
0
0
◦
◦
Harl Bremer Hospital -33 53 36 00 27 2.37 Bellefleur Flats, Bellville -33 54 17 00 -14 5.71
◦
◦
0
0
(SITE 2) 18 36 34 00 (SITE 8) 18 38 47 00
◦ 0 00 ◦ 0 00
Bellville Business Park -33 53 59 Parow Industrial Area -33 55 36
◦ 0 00 -4 2.98 ◦ 0 00 -19 6.04
(SITE 3) 18 36 30 (SITE 9) 18 37 1
0
◦
0 00
◦
-33 54 15 00 University of the Western -33 56 2
Parow Centre (SITE 4) ◦ 0 00 -26 3.21 ◦ 0 00 -9 7.26
18 35 52 Cape (SITE 10) 18 37 49
0
0
◦
◦
Tyger Valley Shopping -33 52 30 00 Unibell Train Station -33 56 15 00
◦ 0 00 30 3.51 ◦ 0 00 -7 7.55
Centre (SITE 5) 18 38 1 (SITE 11) 18 37 42
0
0
◦
◦
Bellville Market (SITE -33 54 12 00 -11 3.89 Henry Peterson Residence -33 56 28 00 -9 8.04
◦
0
◦
0
6) 18 37 14 00 (SITE 12) 18 37 54 00
Table 2: Comparison of calculated vs measured power
Calculate (P r(d)) Measured - Calculated
No. Name d Km Measured (dBm)
(dBm) (dBm)
1 Tygerberg Natural Reserve d 0 = 0.54 P r(d o )= -80.39 Ref. power -
2 Harl Bremmer Hospital 2.37 -97.30 -93.24 -4.06
3 Bellville Business Park 2.98 -86.45 -95.23 8.78
4 Parow Centre 3.21 -93.34 -95.87 2.53
5 Tyger Valley Shopping Centre 3.51 -94.52 -96.65 2.13
6 Bellville Market 3.89 -92.58 -97.54 4.96
7 Tygerberg Hospital 4.18 -96.43 -98.17 1.74
8 Bellefleur Flats 5.71 -97.75 -100.01 2.26
9 Parow Industrial Area 6.04 -91.77 -101.36 9.59
10 UWC 7.26 -97.33 -102,96 5.63
11 Unibell 7.55 -94.25 -103,30 9.05
12 HPR 8.04 -94.23 -103,85 9.62
– 213 –